3D viewing and VTK export#
GeoST makes use of PyVista to allow the user to export data to Visualization Toolkit (VTK) format as well as interactively view data in 3D. In this example we create a simple 3D plot of some boreholes and the GeoTOP model in the area of the Utrecht Science Park (USP).
Let’s import GeoST and PyVista and load the data we are going to work with:
import pyvista as pv

import geost
from geost.bro import GeoTop

# Load the boreholes from the Utrecht Science Park (USP) area
boreholes_usp = geost.data.boreholes_usp()

# Load the GeoTOP model from the OpenDAP server based on the bounding box of the boreholes
geotop_usp = GeoTop.from_opendap(bbox=boreholes_usp.header.total_bounds)

# Let's see what we've got
print("Boreholes:\n", boreholes_usp)
print("\n")
print("Voxel model:\n", geotop_usp)
Downloading file 'boreholes_usp.parquet' from 'https://github.com/Deltares-research/geost/raw/main/data/boreholes_usp.parquet' to '/home/runner/.cache/geost'.
Boreholes:
 Collection
  header (rows, columns) : (67, 5)
  data (rows, columns)   : (1398, 32)
crs: Amersfoort / RD New
vertical datum: NAP height


Voxel model:
 GeoTop
Data variables:
    strat    (y, x, z) float32 316kB dask.array<chunksize=(14, 18, 76), meta=np.ndarray>
    lithok   (y, x, z) float32 316kB dask.array<chunksize=(14, 18, 76), meta=np.ndarray>
    kans_1   (y, x, z) float32 316kB dask.array<chunksize=(14, 18, 76), meta=np.ndarray>
    kans_2   (y, x, z) float32 316kB dask.array<chunksize=(14, 18, 76), meta=np.ndarray>
    kans_3   (y, x, z) float32 316kB dask.array<chunksize=(14, 18, 76), meta=np.ndarray>
    kans_4   (y, x, z) float32 316kB dask.array<chunksize=(14, 18, 76), meta=np.ndarray>
    kans_5   (y, x, z) float32 316kB dask.array<chunksize=(14, 18, 76), meta=np.ndarray>
    kans_6   (y, x, z) float32 316kB dask.array<chunksize=(14, 18, 76), meta=np.ndarray>
    kans_7   (y, x, z) float32 316kB dask.array<chunksize=(14, 18, 76), meta=np.ndarray>
    kans_8   (y, x, z) float32 316kB dask.array<chunksize=(14, 18, 76), meta=np.ndarray>
    kans_9   (y, x, z) float32 316kB dask.array<chunksize=(14, 18, 76), meta=np.ndarray>
    onz_lk   (y, x, z) float32 316kB dask.array<chunksize=(14, 18, 76), meta=np.ndarray>
    onz_ls   (y, x, z) float32 316kB dask.array<chunksize=(14, 18, 76), meta=np.ndarray>
Dimensions: {'y': 14, 'x': 18, 'z': 313}
Resolution (y, x, z): (100.0, 100.0, 0.5)
We have a BoreholeCollection containing 67 boreholes and a GeoTOP model instance of 14 x 18 x 313 voxels. GeoST offers a few options to turn these into PyVista objects:
Method |
PyVista object |
Description |
|---|---|---|
PyVista.MultiBlock |
Fancy cylinder geometries of boreholes |
|
PyVista.UnstructuredGrid |
Simple geometries, useful for large datasets |
|
VoxelModel.to_pyvista_grid(structured=True) |
PyVista.ImageData |
Structured grid, useful for large datasets |
VoxelModel.to_pyvista_grid(structured=False) |
PyVista.UnstructuredGrid |
Individual rendering of each voxel |
We will apply to_pyvista_grid for our boreholes to get a PyVista.UnstructuredGrid and
to_pyvista_grid with structured=True (default) for the GeoTOP model to get a PyVista.ImageData object.
# The boreholes are converted to an unstructured grid of the lithology data. The borehole
# geometries are given a radius of 10 meters.
boreholes_usp_pyvista = boreholes_usp.to_pyvista_grid("lith", radius=10)

# The GeoTOP model is converted to an structured grid of the stratigraphy data
geotop_usp_pyvista = geotop_usp.to_pyvista_grid("strat")

# Let's see what we've got
print("Boreholes PyVista grid:\n", boreholes_usp_pyvista)
print("\n")
print("GeoTOP PyVista grid:\n", geotop_usp_pyvista)
Boreholes PyVista grid:
 UnstructuredGrid (0x7f15441311e0)
  N Cells:    1398
  N Points:   11184
  X Bounds:   1.395e+05, 1.413e+05
  Y Bounds:   4.548e+05, 4.560e+05
  Z Bounds:   -2.712e+02, 8.037e+00
  N Arrays:   1


GeoTOP PyVista grid:
 ImageData (0x7f15fc4f3ca0)
  N Cells:      78876
  N Points:     89490
  X Bounds:     1.396e+05, 1.414e+05
  Y Bounds:     4.548e+05, 4.562e+05
  Z Bounds:     -4.975e+01, 1.068e+02
  Dimensions:   19, 15, 314
  Spacing:      1.000e+02, 1.000e+02, 5.000e-01
  N Arrays:     1
You can use the save method of these PyVista.UnstructuredGrid objects to export them as VTK files and load them into your viewer of choice.
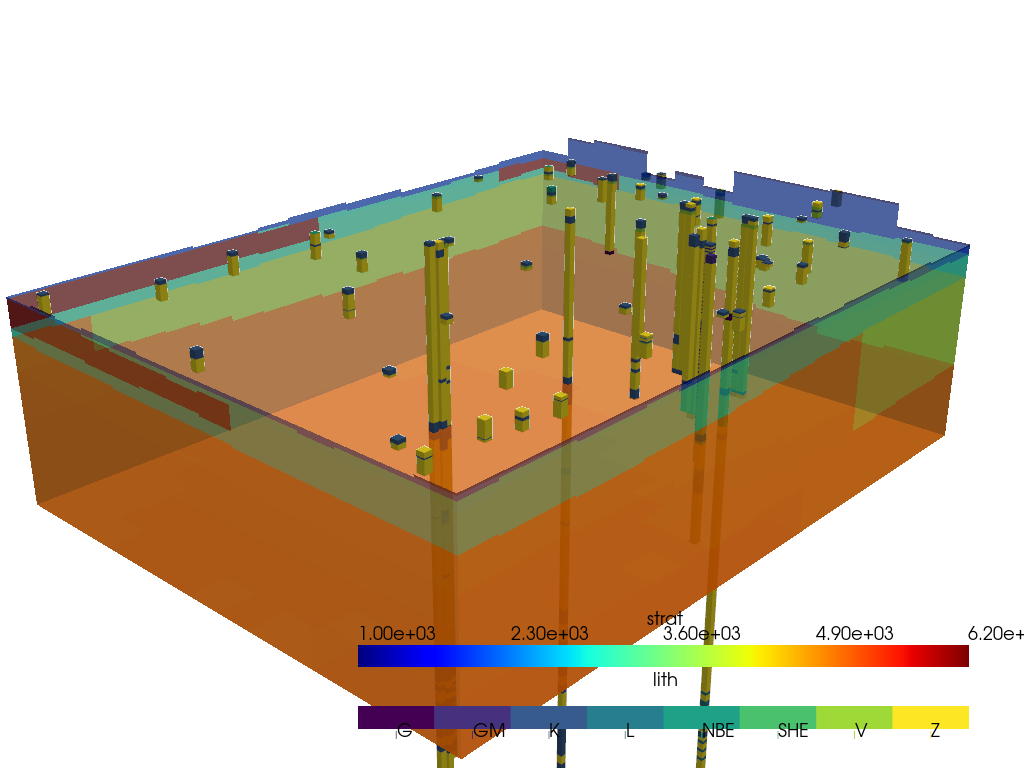
Below is a simple static (and ugly) PyVista plot of the data to get the idea of what is possible. You can create your own fancy 3D viewers when adding proper color scales etcetera, but that is beyond the scope of this simple demo. We typically export the PyVista objects to VTK and use ParaView to view data in 3D.
# Create a simple 3D plot using PyVista
plotter = pv.Plotter()
plotter.add_mesh(boreholes_usp_pyvista, scalars="lith")
plotter.add_mesh(
    geotop_usp_pyvista,
    opacity=0.7,
    scalars="strat",
    nan_opacity=0,
    cmap="jet",
)
plotter.set_scale(zscale=10)
plotter.camera_position = [(142800, 457600, 1100), (140400, 455400, -300), (0, 0, 1)]
plotter.show(jupyter_backend="static")
2026-06-23 14:04:50.400 (  46.849s) [    7F16022E7740]vtkXOpenGLRenderWindow.:1460  WARN| bad X server connection. DISPLAY=
2026-06-23 14:04:50.401 (  46.850s) [    7F16022E7740]vtkEGLRenderWindowInter:251   WARN| Setting an EGL display to device index: -1 require EGL_EXT_device_base EGL_EXT_platform_device EGL_EXT_platform_base extensions
2026-06-23 14:04:50.401 (  46.850s) [    7F16022E7740]vtkEGLRenderWindowInter:257   WARN| Attempting to use the default egl display for the current platform...
2026-06-23 14:04:50.401 (  46.850s) [    7F16022E7740]vtkEGLRenderWindowInter:263   WARN| Could not initialize a device. Exiting...
2026-06-23 14:04:50.401 (  46.850s) [    7F16022E7740]vtkEGLRenderWindowInter:307   WARN| Could not set device as display. EGL_EXT_device_base, EGL_EXT_platform_device and EGL_EXT_platform_base extensions are required.
2026-06-23 14:04:50.401 (  46.850s) [    7F16022E7740]vtkOpenGLRenderWindow.c:916   WARN| vtkEGLRenderWindow (0x5597013e0510): Failed to initialize OpenGL functions!
2026-06-23 14:04:50.401 (  46.850s) [    7F16022E7740]vtkOpenGLRenderWindow.c:935   WARN| vtkEGLRenderWindow (0x5597013e0510): Unable to find a valid OpenGL 3.2 or later implementation. Please update your video card driver to the latest version. If you are using Mesa please make sure you have version 11.2 or later and make sure your driver in Mesa supports OpenGL 3.2 such as llvmpipe or openswr. If you are on windows and using Microsoft remote desktop note that it only supports OpenGL 3.2 with nvidia quadro cards. You can use other remoting software such as nomachine to avoid this issue.
2026-06-23 14:04:50.414 (  46.863s) [    7F16022E7740]vtkEGLRenderWindowInter:251   WARN| Setting an EGL display to device index: -1 require EGL_EXT_device_base EGL_EXT_platform_device EGL_EXT_platform_base extensions
2026-06-23 14:04:50.414 (  46.863s) [    7F16022E7740]vtkEGLRenderWindowInter:257   WARN| Attempting to use the default egl display for the current platform...
2026-06-23 14:04:50.414 (  46.863s) [    7F16022E7740]vtkEGLRenderWindowInter:263   WARN| Could not initialize a device. Exiting...
2026-06-23 14:04:50.414 (  46.863s) [    7F16022E7740]vtkEGLRenderWindowInter:307   WARN| Could not set device as display. EGL_EXT_device_base, EGL_EXT_platform_device and EGL_EXT_platform_base extensions are required.
2026-06-23 14:04:50.414 (  46.863s) [    7F16022E7740]vtkOpenGLRenderWindow.c:916   WARN| vtkEGLRenderWindow (0x5597013e0510): Failed to initialize OpenGL functions!
2026-06-23 14:04:50.414 (  46.863s) [    7F16022E7740]vtkOpenGLRenderWindow.c:935   WARN| vtkEGLRenderWindow (0x5597013e0510): Unable to find a valid OpenGL 3.2 or later implementation. Please update your video card driver to the latest version. If you are using Mesa please make sure you have version 11.2 or later and make sure your driver in Mesa supports OpenGL 3.2 such as llvmpipe or openswr. If you are on windows and using Microsoft remote desktop note that it only supports OpenGL 3.2 with nvidia quadro cards. You can use other remoting software such as nomachine to avoid this issue.