DIS3.1 from the Deltares OpenDAP server#
DIS (Delfstoffen Informatie Systeem) is a geological voxelmodel created for sand mining within in the 12-mile zone of the Dutch North Sea. See this Deltares webpage for more information on the DIS
ℹ️ This example is work-in-progress. Additional features and examples will follow in future versions of GeoST
In this example we will download a small part of the DIS model using a bounding box in WGS84 UTM 31N coordinates (EPSG:32631) that roughly covers the offshore sand mining areas Q16-6 and Q16-4.
import geost

# Load DIS voxel model from OpenDAP server with bounding box
dis = geost.read_model_from_opendap(
    r"https://opendap.deltares.nl/thredds/dodsC/opendap/rijkswaterstaat/DIS/DIS3.1.nc",
    bbox=(561_000, 5_770_000, 569_000, 5_775_500),
)
dis  # Inspect the loaded DIS voxel model
<xarray.Dataset> Size: 48MB
Dimensions:               (y: 28, x: 40, z: 94)
Coordinates:
  * y                     (y) float64 224B 5.77e+06 5.77e+06 ... 5.776e+06
  * x                     (x) float64 320B 5.611e+05 5.613e+05 ... 5.689e+05
  * z                     (z) float32 376B -55.25 -54.75 -54.25 ... -9.25 -8.75
    spatial_ref           int64 8B 0
Data variables: (12/114)
    lithoklasse           (y, x, z) float32 421kB ...
    slibklasse            (y, x, z) float32 421kB ...
    schelpenklasse        (y, x, z) float32 421kB ...
    stratunit             (y, x, z) float32 421kB ...
    kans_lithoklasse_1    (y, x, z) float32 421kB ...
    kans_lithoklasse_2    (y, x, z) float32 421kB ...
    ...                    ...
    litho_realisatie_096  (y, x, z) float32 421kB ...
    litho_realisatie_097  (y, x, z) float32 421kB ...
    litho_realisatie_098  (y, x, z) float32 421kB ...
    litho_realisatie_099  (y, x, z) float32 421kB ...
    litho_realisatie_100  (y, x, z) float32 421kB ...
    bathy                 (y, x) float32 4kB ...
Attributes:
    epsg:                    32631
    Units:                   Meter
    Resolution:              200 x 200 x 0.5 m (y, x, z)
    Coordinates:             Cellcenters
    Model:                   DIS 3.1
    Source_software:         Isatis
    Organisation:            Rijkswaterstaat, Deltares, TNO
    Conventions:             CF-1.0
    Creator_NetCDF_dataset:  Deltares
E-mail: tommer.vermaas@deltares.nlWe can apply any method available from GeoST’s extension of Xarray to further select and analyse the downloaded DIS model.
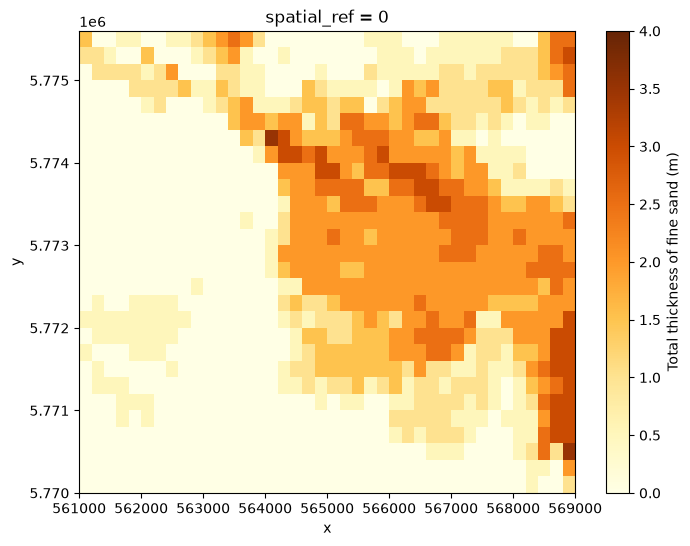
Let’s e.g. find the total thickness of fine sand and very fine sand between the -20 and -25 m MSL depth interval. For this we will use the ‘lithoklasse’ data variable which classifies lithology. First, let’s do a quick inspection of the “lithoklasse” variable.
print(dis["lithoklasse"].attrs)
{'1': 'Zand uiterst fijn (63-105)', '2': 'Zand matig fijn-zeer fijn (105-210)', '3': 'Zand matig grof (210-300)', '4': 'Zand zeer grof (300-420)', '5': 'Zand uiterst grof (420-2000)', '6': 'Zand (ongedifferentieerd)', '7': 'Klei/Leem', '8': 'Veen', '9': 'Schelpen', '_ChunkSizes': array([30, 60, 12], dtype=int32)}
We can see that lithoclasses 1 and 2 represent the required sand fractions so we use these to determine the total thickness of (very) fine sand within our depth interval.
dis_selected = dis.gst.slice_depth_interval(upper=-20, lower=-25)
dis_sand = dis_selected.gst.get_thickness(dis_selected["lithoklasse"] <= 2)

dis_sand.plot.imshow(
    figsize=(8, 6),
    cmap="YlOrBr",
    vmin=0,
    vmax=4,
    cbar_kwargs={"label": "Total thickness of fine sand (m)"},
)
<matplotlib.image.AxesImage at 0x7b55387f5550>