Database Builder (executable)
Configuration file attributes
Header attributes
Figure 1 shows the mandatory attributes that are given at the top of the configuration file. These are required for all configurations, including the baseline configuration. These will be described below.
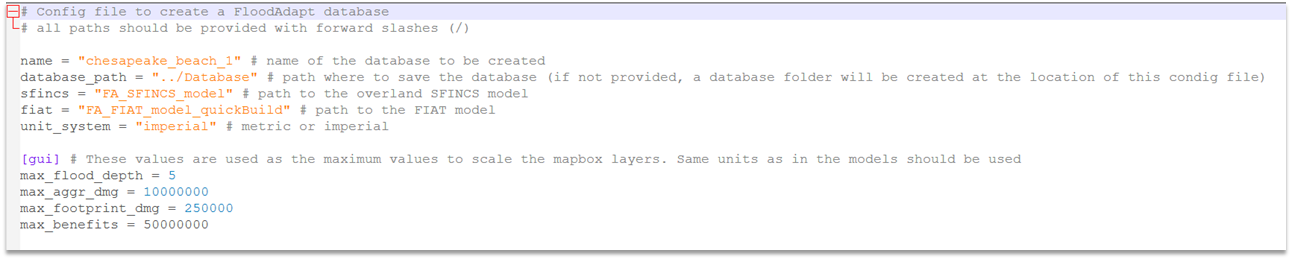
Mandatory attributes are:
- name - this is the name of the database folder for your site
- database_path - this is the path where your database folder will be saved
- sfincs - this is the location of your SFINCS overland model
- fiat - this is the location of your Delft-FIAT model
- unit system - this is either “imperial” or “metric”
Figure 2 shows the optional attributes that are given at the top of the configuration file. These will be described below.
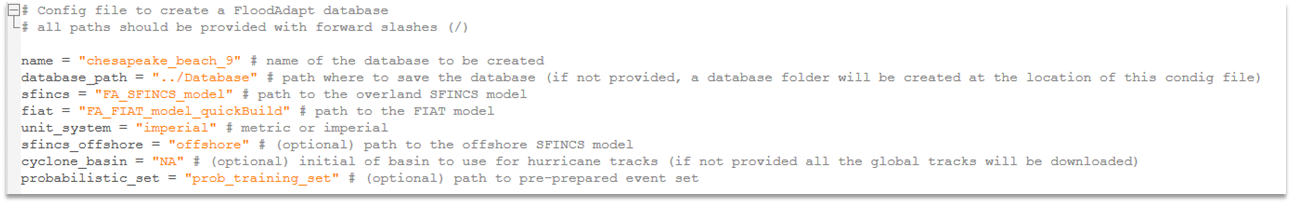
Optional attributes are:
- sfincs_offshore - this is the location of your SFINCS offshore model.
- cyclone_basin - this is the region code (given with quotation marks around it, see Figure 2) where your site is located, for filtering the tropical cyclones (hurricanes) that show up in the hurricane selection window in FloodAdapt. Region codes are described below this list.
- probabilistic_set - this is the path to the prepared event set and event frequencies which enable risk analysis
- cyclones - this is by default “True”, but if set to “False” hurricanes will not show up as an option when a user selects “Add Event” in FloodAdapt
For the cyclone_basin the region code options are:
- NA = North Atlantic
- SA = South Atlantic
- EP = Eastern North Pacific (which includes the Central Pacific region)
- WP = Western North Pacific
- SP = South Pacific
- SI = South Indian
- NI = North Indian
GUI attributes

Figure 3 shows the attributes that are required for the GUI. These are mandatory attributes that must be included in all configuration files, including the base configuration file.
The GUI attributes all have to do with maximum values. These are used to create automatic bins for the spatial mapping of flooding, impacts, and benefits.
Start the GUI attribute section with [gui]. The values that need to be specified are:
- max_flood_depth - this will be the highest legend value in the output flood maps (above which all values get the same color).
- max_aggr_dmg - this will be the highest legend value in the output aggregated damages maps (above which all values get the same color). A good choice for this value will depend on the size of your aggregation, the density of the building footprints, and the currency value in the application area. It can be difficult to know apriori what to pick here, but the value can always be changed later in the FloodAdapt database static/site.toml file under the [gui.output_layers] section.
- max_footprint_dmg - this will be the highest legend value in the output building damages maps (above which all values get the same color), and can be estimated based on the maximum potential values of the buildings in the site area.
- max_benefits - this is the maximum value for the spatial benefits. This can also be difficult to estimate apriori, but can be changed later in the FloodAdapt database static/site.toml file under the [gui.output_layers] section.
Building footprints
The attributes for building footprints are shown in Figure 4. A building footprint layer allows users to visualize the building footprint damages in the output maps (instead of only points). Note that if a building footprint file is not included, the database-builder will automatically add Open Street Map building footprints to support the visualization of building damages in the FloodAdapt application.
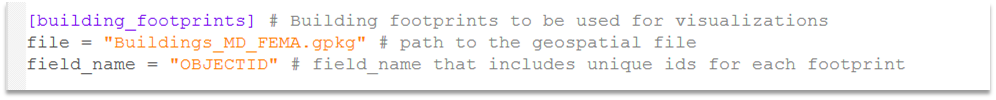
For building footprints, start the section with [building_footprints] and provide the following attributes:
- file - this is the path to the building footprint file (this should be a vector file, like a shapefile or a geopackage), making sure to use forward slahses in the paths.
- field_name - this should be a unique identifier attribute in the vector file, like an Object ID.
Tide Gauge
The attributes needed to include a tide gauge are shown in Figure 5. The inclusion of a tide gauge allows FloodAdapt users to automatically download water levels for a specified start and end time.
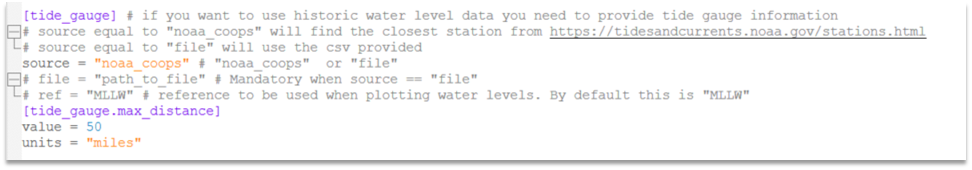
For a tide gauge, start the section with [tide_gauge] and provide the following attributes:
- source - this is either “noaa_coops” if you want to use the closest NOAA gauge station from https://tidesandcurrents.noaa.gov/stations.html (only available in the U.S.) OR “file” if you will be providing gauge data (water level time series) in a CSV file.
- file - this is only required if the source is equal to “file”. It should be the path to a CSV file containing the gauged water level time series. The CSV file should have two columns; the first contains a ‘datetime’ in the format DD/MM/YYYY HH:MM and the second column contains the water levels relative to mean sea level.
- ref - this is an optional attribute; if provided, it will be used as the ‘zero’ when plotting event water levels in the event specification window of FloodAdapt.
- [tide_gauge.max_distance] - this is a section to specify the maximum radius around the site to search for a tidal gauge station. This prevents tide gauges being applied to a site that are too far away to be representative. The attributes that fall under this are value which gives a numeric value for the distance, and units which specifies the unit of the value (e.g. “miles”). See Figure 5 for an example.
Social vulnerability index (SVI)
The attributes needed to include an SVI layer are shown in Figure 6. The inclusion of an SVI layer allows FloodAdapt users to get additional information in the infographic related to who is being impacted, and to view the layer in the FloodAdapt Measures and Output tabs.

For an SVI layer, start the section with [svi] and provide the following attributes:
- file - this is the path to the geospatial file with the SVI layer
- field_name - this is the name of the attribute in the geospatial file that contains the social vulnerability index.
- threshold - this is the value of the SVI above which homes will be considered to have a high social vulnerability.
Base flood elevation (BFE)
The attributes needed to include a BFE layer are shown in Figure 7. The inclusion of a BFE layer allows FloodAdapt users to elevate buildings relative to this layer, in addition to being able to elevate relative to datum.

For a BFE layer, start the section with [bfe] and provide the following attributes:
- file - this is the path to the geospatial file with the BFE layer
- field_name - this is the name of the attribute in the geospatial file that contains the base flood elevation.
Sea level rise (SLR) scenarios
The attributes needed to include SLR scenarios are shown in Figure 8. The inclusion of a SLR scenarios file allows FloodAdapt users to enter a future sea level rise projection by selecting a SLR scenario and a year in the Projections window of FloodAdapt.

For SLR scenarios, start the section with [slr_scenarios] and provide the following attributes:
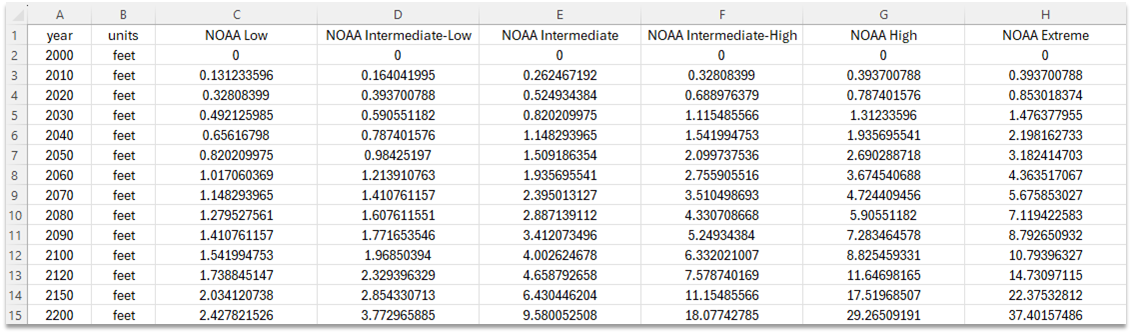
- file - this is the path to the CSV file that contains the SLR scenario information. Figure 9 shows an example of the CSV file format. The first column should contain the year, the second column the units, and each additional column should contain the projections at the specified years in column 1. Each SLR scenario column should contain a header with the name of the SLR scenario. These are the names that will show up in the Projections window.
- relative_to_year - this is the year you want the SLR projections relative to. Often SLR scenarios are relative to an older date, for example the year 2000. If you want to know how a recent event would look with SLR, you will want to know the SLR relative to a more recent year. The relative_to_year does not need to be exactly the current year, but should be within a few years of events of interest. When a user selects a SLR scenario and a year, FloodAdapt will then automatically calculate the SLR relative to the date selected here.
Observation points
The attributes needed to include observation points are shown in Figure 10. The inclusion of observation points allows FloodAdapt users to visualize a time series of water levels at these points throughout a simulated event (rather than only a maximum flood depth as is shown in the spatial maps).
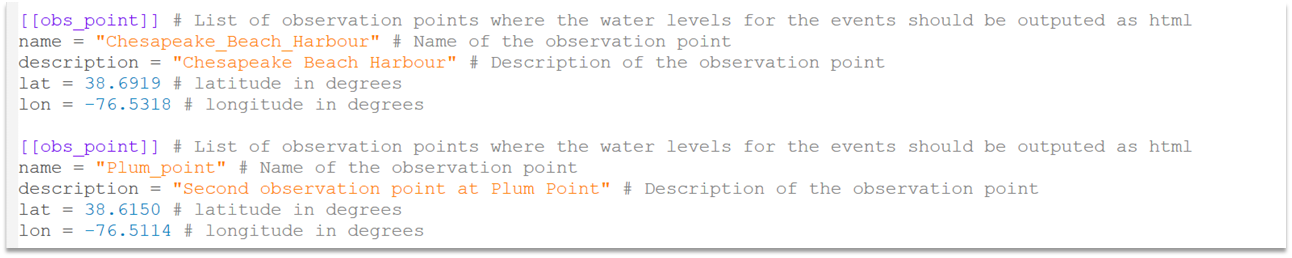
Users can enter multiple observation points. These are treated as a list, which means that each observation point gets its own section with the same name (obs_point), enclosed in a double square bracket.
For observation points, start the section with [[obs_point]] (one for each observation point) and provide the following attributes:
- name - this is the name of your observation point. This name cannot contain spaces or special characters.
- description - this a descriptive name of your observation point. This will show up at the top of the time series plot in the FloodAdapt Output tab.
- lat - this is the latitude of your observation point.
- lon - this is the longitude of your observation point.