FloodAdapt User Guide
Welcome to the FloodAdapt user guide! This guide will help you learn how to set up and run scenarios to assess current and future flood impacts and risks. It also shows how to evaluate scenario output, and explore the benefits of different adaptation options. FloodAdapt lets you create, run, visualize, and compare scenarios. For an overview of what FloodAdapt is and how it works, see the Introduction page. To install the application and begin using it, head to the Getting Started page.
A FloodAdapt “scenario” refers to a combination of (1) a weather event that can lead to flooding, like a hurricane, coastal storm, or heavy rainfall, (2) a projection representing future socio-economic or climate conditions and (3) a strategy, which can include any number of adaptation options.
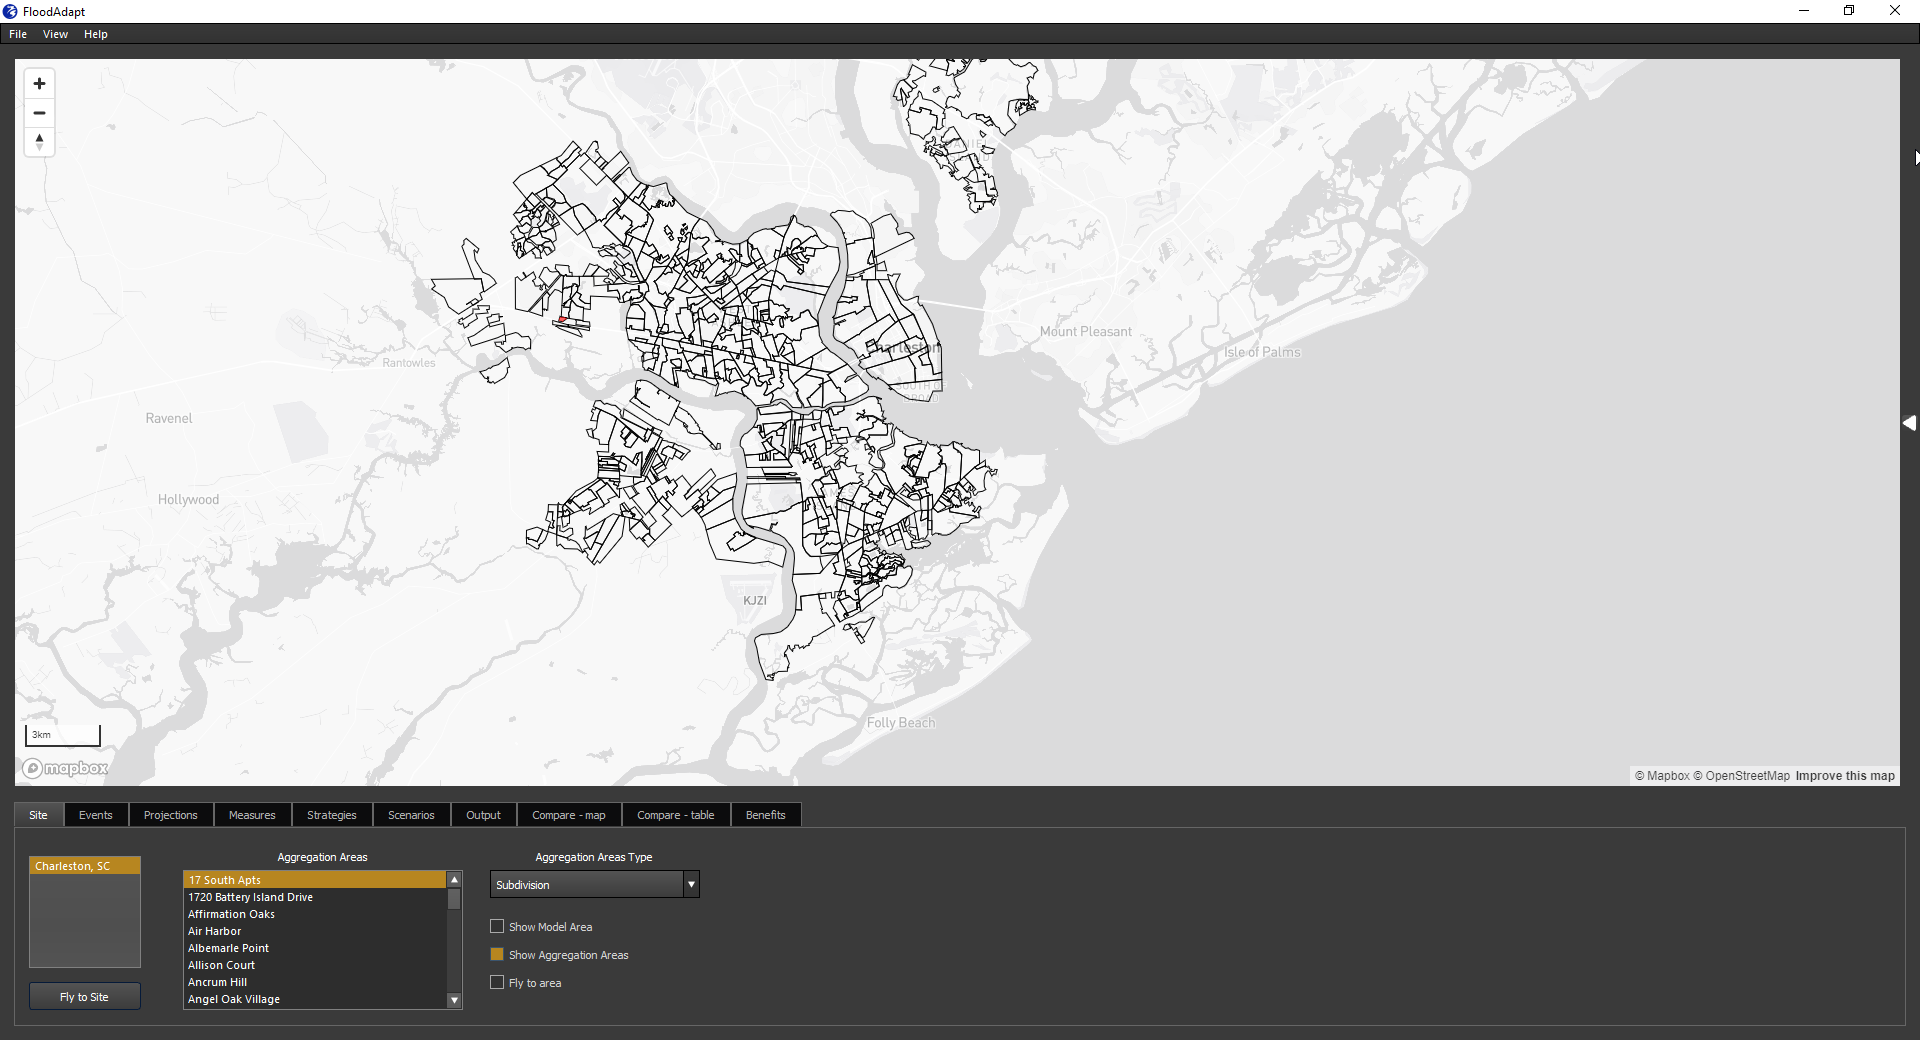
Figure 1 shows the FloodAdapt application. There are a number of tabs in the lower panel. FloodAdapt is designed for users to walk through these tabs to create events, projections, measures, and strategies. The Scenarios tab then supports the creation and simulation of scenarios, after which results can be viewed in the Output and Comparison tabs. FloodAdapt also supports the evaluation of benefits in the Benefits tab.
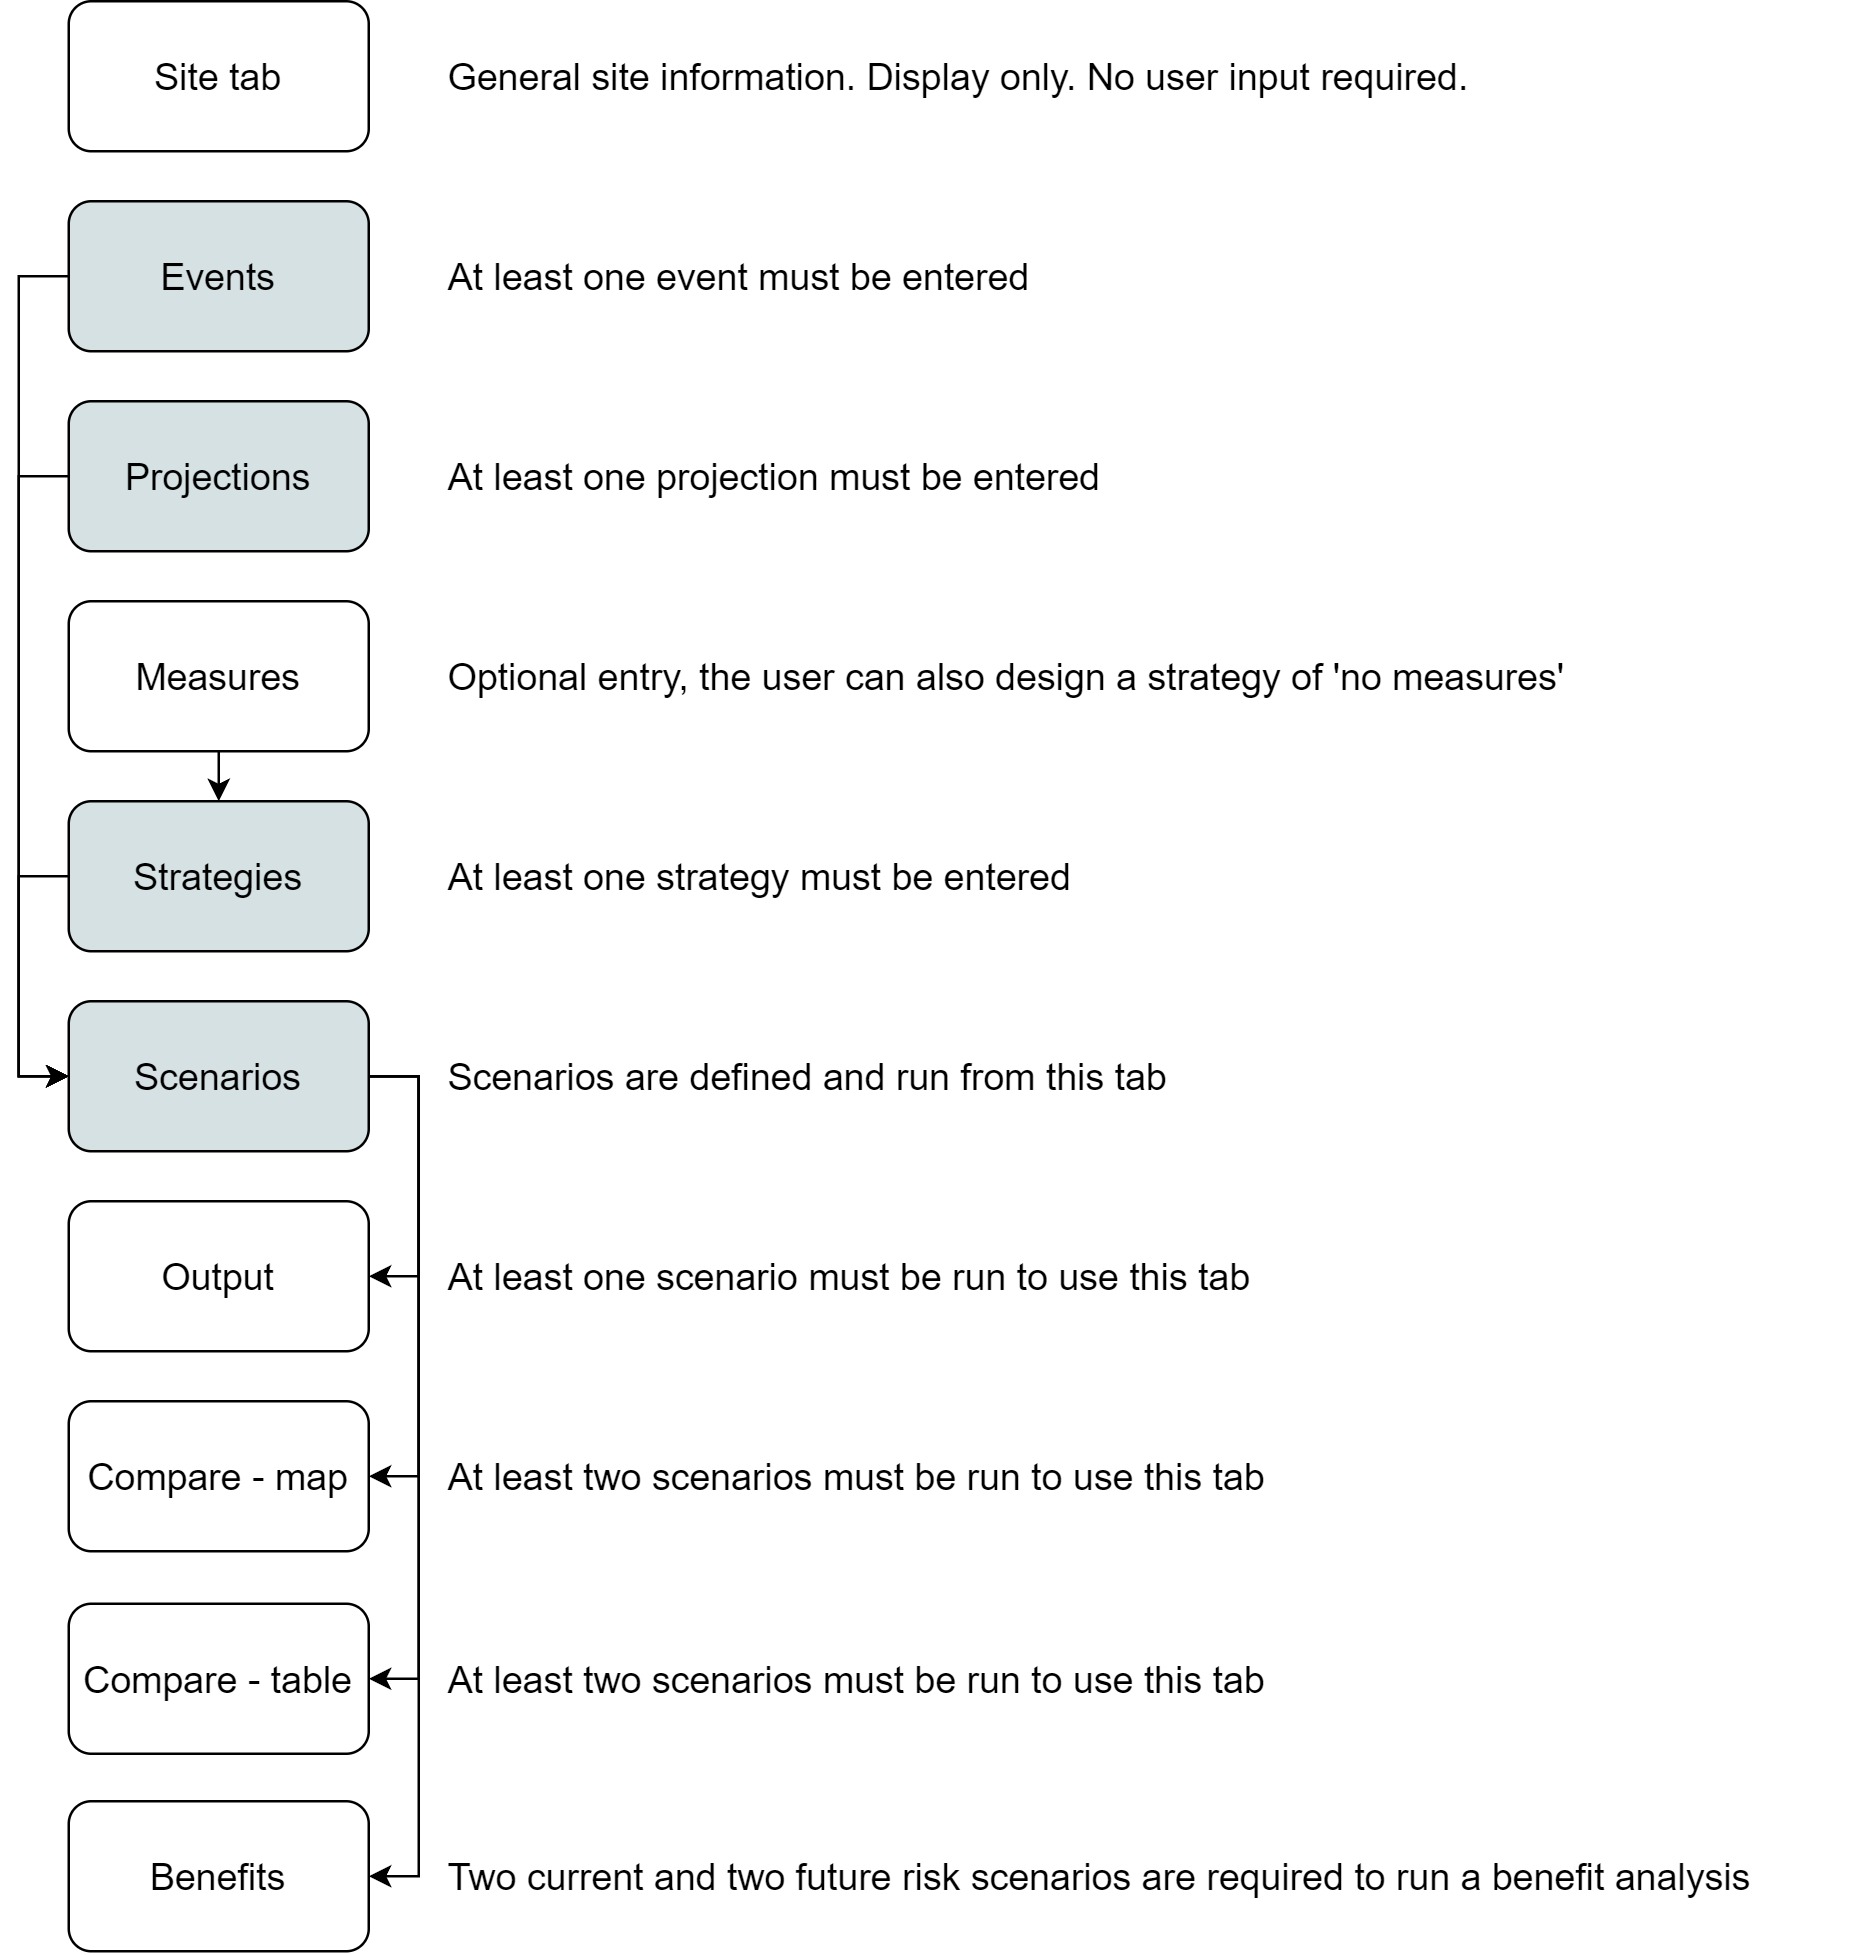
Each of the FloodAdapt tabs is described briefly below with a link to visit the detailed documentation for that tab. The user guide content can also be found in the left-hand navigation pane. Figure 2 presents a diagram showing the tabs of the user interface and highlighting the information needed to run scenarios and benefit analyses, and view results.
The Site tab is an informative tab where the user is not required to input any information.
The Events, Projections, Measures, and Strategy tabs are input tabs where the user will specify the ‘ingredients’ for their scenarios.
The Scenarios tab is a management tab, where the user can specify and run scenarios.
The Output tab is where a user can view maps showing the flooding and impacts and see infometrics and an infographic for scenarios that have been run.
The user can compare scenarios spatially (map comparison) in the Compare - map tab and can compare scenarios based on their tabulated metrics in the Compare - table tab.
The user can evaluate the risk-reduction benefits of an adaptation strategy, including spatial distribution of benefits, and equity-weighted benefits in the Benefits tab.