import flood_adapt.objects.forcing as f

from pathlib import Path
from datetime import datetime

from flood_adapt.objects import SyntheticEvent, TimeFrame
from flood_adapt import unit_system as us
from flood_adapt import FloodAdapt, Settings

# Setup FloodAdapt
STATIC_DATA_DIR = Path("../../_data/examples/static-data").resolve()
settings = Settings(
    DATABASE_ROOT=Path("../../_data/examples").resolve(),
    DATABASE_NAME="charleston_test"
)
fa = FloodAdapt(database_path=settings.database_path)📘 Example: Creating a Synthetic Event in FloodAdapt
This notebook demonstrates how to create a synthetic event using FloodAdapt. Synthetic events are valuable for controlled testing, sensitivity analysis, and understanding the behavior of flood models under simplified or hypothetical scenarios.
A FloodAdapt Event consists of 2 things:
- a
TimeFramedescribing the start and end time of the hazard simulation(s) - a collection of forcings to be applied to the hazard model(s)
In this example, we construct a full synthetic event with water level, rainfall, wind, and river discharge forcings, and then save it to a FloodAdapt database.
⏱️ Step 1. Setup and Imports
We begin by importing the required classes and modules for constructing synthetic forcings and managing event data within the FloodAdapt framework.
🗓️ Step 2. Define the Simulation Time Frame
We specify a one-day time frame for the SyntheticEvent, from January 1 to January 2, 2025.
# Create an time frame for the simulation
start_time = datetime(year=2025, month=1, day=1)
end_time = datetime(year=2025, month=1, day=2)
time_frame = TimeFrame(start_time=start_time, end_time=end_time)
🌊 Step 3. Define Water Level Forcing
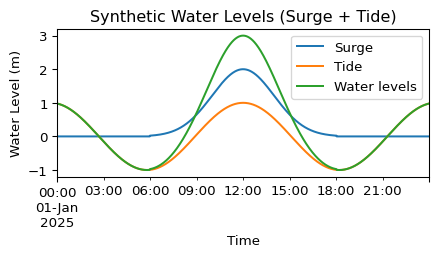
Synthetic water levels are constructed from a combination of tidal and surge components. All FloodAdapt events require exactly 1 water level forcing, all other forcings are optional.
# Synthetic water levels can be computed from a combination of surge and tide.
surge = f.SurgeModel(
    timeseries=f.GaussianTimeseries(
        duration=us.UnitfulTime(value=12, units=us.UnitTypesTime.hours),
        # Choose the middle of the time frame for peak time
        peak_time=us.UnitfulTime.from_timedelta(time_frame.duration / 2),
        peak_value=us.UnitfulLength(value=2, units=us.UnitTypesLength.meters),
    )
)

tide = f.TideModel(
    harmonic_amplitude=us.UnitfulLength(value=1, units=us.UnitTypesLength.meters),
    # Choose the middle of the time frame for peak time
    harmonic_phase=us.UnitfulTime.from_timedelta(time_frame.duration / 2),
    harmonic_period=us.UnitfulTime(value=12.4, units=us.UnitTypesTime.hours),
)

water_levels_synthetic = f.WaterlevelSynthetic(
    surge=surge,
    tide=tide,
)

# Inspect
gaussian = surge.timeseries.to_dataframe(time_frame=time_frame)
gaussian.columns = ["Surge"]
harmonic = tide.to_dataframe(time_frame=time_frame)
harmonic.columns = ["Tide"]
total = water_levels_synthetic.to_dataframe(time_frame=time_frame)
total.columns = ["Water levels"]
df_combined = gaussian.join(harmonic).join(total)
df_combined.plot(
    title="Synthetic Water Levels (Surge + Tide)",
    xlabel="Time",
    ylabel="Water Level (m)",
    legend=True,
    figsize=(5, 2)
)
🧩 Step 4. Create a minimal event and modify it
Given a water level forcing, and a TimeFrame, you can create the simplest possible event in FloodAdapt as shown below.
In many cases, it is interesting to to investigate a combination of different forcings. In steps 5 - 9, we will show the creation of various forcings and how to add them to an event.
simple_event = SyntheticEvent(
    name="simple_event",
    time=time_frame,
    forcings={
        f.ForcingType.WATERLEVEL: [water_levels_synthetic],
    }
)
🌧️ Step 5. Define Rainfall Forcing
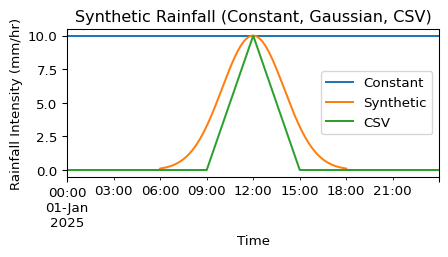
The rainfall options for a synthetic event are:
- Constant: Constant rainfall intensity for the entire simultion period and spatially uniform across the model domain.
- Synthetic: Custom rainfall intensity timeseries built from key parameters applied spatially uniform across the entire model domain. The key parameters can be used to describe either a gaussian-, block- or triangle-shaped rainfall curve.
- CSV: Custom rainfall intensity from a csv file applied spatially uniform across the entire model domain.
rainfall_constant = f.RainfallConstant(
    intensity=us.UnitfulIntensity(value=10, units=us.UnitTypesIntensity.mm_hr)
)

rainfall_synthetic = f.RainfallSynthetic(
    timeseries=f.GaussianTimeseries(
        duration=us.UnitfulTime(value=12, units=us.UnitTypesTime.hours),
        # Choose the middle of the time frame for peak time
        peak_time=us.UnitfulTime.from_timedelta(time_frame.duration / 2),
        peak_value=us.UnitfulIntensity(value=10, units=us.UnitTypesIntensity.mm_hr),
    )
)

rainfall_csv = f.RainfallCSV(path=STATIC_DATA_DIR / "rainfall.csv")

# Inspect
df_constant = rainfall_constant.to_dataframe(time_frame=time_frame)
df_constant.columns = ["Constant"]
df_synthetic = rainfall_synthetic.to_dataframe(time_frame=time_frame)
df_synthetic.columns = ["Synthetic"]
df_csv = rainfall_csv.to_dataframe(time_frame=time_frame)
df_csv.columns = ["CSV"]

df_combined = df_constant.join(df_synthetic).join(df_csv)
df_combined.plot(
    title="Synthetic Rainfall (Constant, Gaussian, CSV)",
    xlabel="Time",
    ylabel="Rainfall Intensity (mm/hr)",
    legend=True,
    figsize=(5, 2)
)
🌬️ Step 5. Define Wind Forcing
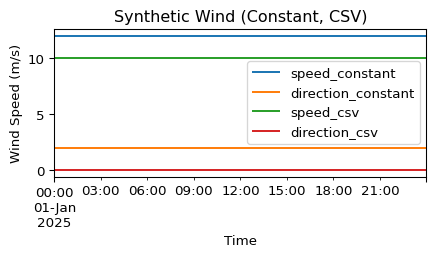
The wind options for a synthetic event are:
- CSV: Custom wind speed and direction from a csv file applied spatially uniform across the entire model domain.
- Constant: Constant wind speed and direction is applied spatially uniform across the entire model domain.
Note: Wind set up in embayments, lagoons etc is only included for the water bodies included in the overland model. Large scale wind effects creating surges and wind set up are typically included in the water level forcing. When the water level forcing is set to “Model” (see ‘Historical Event’), this effect can be simulated by FloodAdapt in the offshore model.
wind_constant = f.WindConstant(
    speed=us.UnitfulVelocity(value=12, units=us.UnitTypesVelocity.mps),
    direction=us.UnitfulDirection(value=2, units=us.UnitTypesDirection.degrees)
    # 0 degrees is North, 90 degrees is East, 180 degrees is South, and 270 degrees is West
)

wind_csv = f.WindCSV(path=STATIC_DATA_DIR / "wind.csv")

# Inspect
df = wind_constant.to_dataframe(time_frame=time_frame)
df.columns = ["speed", "direction"]
df_csv = wind_csv.to_dataframe(time_frame=time_frame)
df_csv.columns = ["speed", "direction"]
df_combined = df.join(df_csv, lsuffix="_constant", rsuffix="_csv")
df_combined.plot(
    title="Synthetic Wind (Constant, CSV)",
    xlabel="Time",
    ylabel="Wind Speed (m/s)",
    legend=True,
    figsize=(5, 2),
)
🏞️ Step 6. Define River Discharge Forcing
Discharge is required to be defined for all pre-configured rivers. These rivers are registered in the hazard model configuration beforehand and it is important that the order of rivers and their source locations are consistent with the setup of the hazard model. The timeseries data provided will determine the in-flow of water at the river’s location.
Discharge options for a SyntheticEvent are:
- Constant: Constant discharge for the entire simulation period.
- CSV: Custom discharge specified in a csv file.
- Synthetic: Custom discharge timeseries built from key parameters. The key parameters can be used to describe either a gaussian-, block- or triangle-shaped rainfall curve.
# The available rivers are defined in the hazard model when creating the database.
# You cannot add new rivers to the model in an event, you can only set the discharge of each given river.
print(f"Number of available rivers: {len(fa.database.site.sfincs.river)}")

river = fa.database.site.sfincs.river[0]

discharge_constant = f.DischargeConstant(
    river=river,
    discharge=us.UnitfulDischarge(value=100, units=us.UnitTypesDischarge.cms)
)

discharge_synthetic = f.DischargeSynthetic(
    river=river,
    timeseries=f.BlockTimeseries(
        duration=us.UnitfulTime(value=12, units=us.UnitTypesTime.hours),
        # Choose the middle of the time frame for peak time
        peak_time=us.UnitfulTime.from_timedelta(time_frame.duration / 2),
        peak_value=us.UnitfulDischarge(value=80, units=us.UnitTypesDischarge.cms),
    )
)

discharge_csv = f.DischargeCSV(
    river=river,
    path=STATIC_DATA_DIR / "discharge.csv"
)

# Inspect
df_constant = discharge_constant.to_dataframe(time_frame=time_frame)
df_constant.columns = ["Constant"]
df_synthetic = discharge_synthetic.to_dataframe(time_frame=time_frame)
df_synthetic.columns = ["Synthetic"]
df_csv = discharge_csv.to_dataframe(time_frame=time_frame)
df_csv.columns = ["CSV"]
df_combined = df_constant.join(df_synthetic).join(df_csv)
df_combined.plot(
    title="Synthetic Discharge (Constant, Gaussian, CSV)",
    xlabel="Time",
    ylabel="Discharge (cms)",
    legend=True,
    figsize=(5, 2)
)
Number of available rivers: 1
🧩 Step 7. Combine Forcings and Create Synthetic Event
All defined forcings are collected into a single dictionary, which is used to construct a SyntheticEvent. Now construct the forcings dictionary that contains the forcings you want to include.
NOTE: each event can only have 1 forcing of the types:
water level,rainfallandwind. Fordischargehowever, each river is required to have a forcing associated with it.
# Create a SyntheticEvent with the forcings and time frame
full_event = SyntheticEvent(
    name="example_synthetic_event",
    time=time_frame,
    forcings={
        f.ForcingType.WATERLEVEL: [water_levels_synthetic],
        f.ForcingType.RAINFALL: [rainfall_constant],
        f.ForcingType.WIND: [wind_csv],
        f.ForcingType.DISCHARGE: [discharge_synthetic],
        # The discharge list needs to be exactly as long as the number of rivers in the hazard model
    },
)
💾 Step 8. Save the Event to a FloodAdapt Database
Finally, we save the event to a FloodAdapt database.
# Save the event to the database
fa.save_event(event=full_event)