FloodAdapt Technical documentation
Welcome to the FloodAdapt technical documentation. This section is intended for readers with a technical or modeling background who want to better understand the calculations within FloodAdapt.
The technical documentation covers the technical details of four calculation frameworks:
- Event scenarios (flooding and impacts)
- Risk scenarios (flooding, impacts, and risk)
- Equity-weighted expected annual damages
- Benefits
Each of these are introduced below with a link to the detailed documentation.
Event scenarios
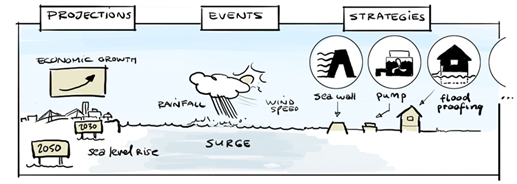
An event scenario in FloodAdapt is a what-if situation and consists of a hydro-meteorological event, a climate and/or socio-economic projection, and a strategy. For example, an event scenario could be “Hurricane Ian (event) with 1 foot of sea level rise (projection) with a floodwall (strategy)”. This scenario could be compared with “Hurricane Ian with 1 foot of sea level rise with no measures implemented” to see how well a floodwall would prevent flooding and damages for this event under future sea level rise. Once you have defined at least one event, projection, and strategy, you are ready to create a scenario. Users can evaluate both event scenarios and risk scenarios.
Click here to read the technical documentation for an event scenario calculation
Risk scenarios
A risk scenario is very similar to an event scenario. It also consists of a climate and/or socio-economic projection and a strategy. However, instead of being specified for one single hydro-meteorological event, a risk scenario consists of a set of (compound) events, all of which could lead to flooding in the project area. Each event in the set is also accompanied by a frequency of occurrence. FloodAdapt simulates the flooding for each event in the event set, and subsequently derives return period flood maps (such as the 10-year, 25-year, or 100-year flood maps) and return period damage maps. It then combines this information to further derive expected annual damages, which is the metric associated with economic risk.
Click here to read the technical documentation for a risk scenario calculation
Equity
Equity methods account for income disparity among residents in the community. The equity-weighting method used in Kind et al. is applied in FloodAdapt to calculated equity-weighted expected annual damages. The method makes use of the utility curve, which relates a loss in income to a loss in ‘utility’ or well-being. This changes depending on the income level. The equity weights are essentially the relative utility loss compared to the average in the community. The method relies on income and population data derived at census block group level, and therefore the equity-weighted expected annual damages are only available at this same scale.
Benefits
Flood adaptation measures are designed to reduce flood risk, and are typically evaluated by calculating their risk-reduction benefits and the benefit-cost ratio, which compares benefits with the implementation and maintenance costs of the measure(s).
FloodAdapt supports users in evaluating the risk-reduction benefits of strategies by automating the benefit calculation and guiding the user in the creation of the scenarios needed to calculate benefits. The user guide section on benefits provides comprehensive guidance on preparing and evaluating benefits in FloodAdapt.
Click here to read technical documentation describing the benefit calculation in FloodAdapt.