Risk Scenario
A risk scenario is similar to an event scenario, but instead of running for one single event FloodAdapt runs the flood model for every event in a probabilistic event set. This is a set consisting of specifications for different (compound) events that can lead to flooding in the area and their occurrence frequencies. A paper describing how this event set was prepared for Charleston, South Carolina can be found here.
The hazard calculation and impact & risk calculation frameworks for a risk scenario are presented in the sections below.
Hazard calculation
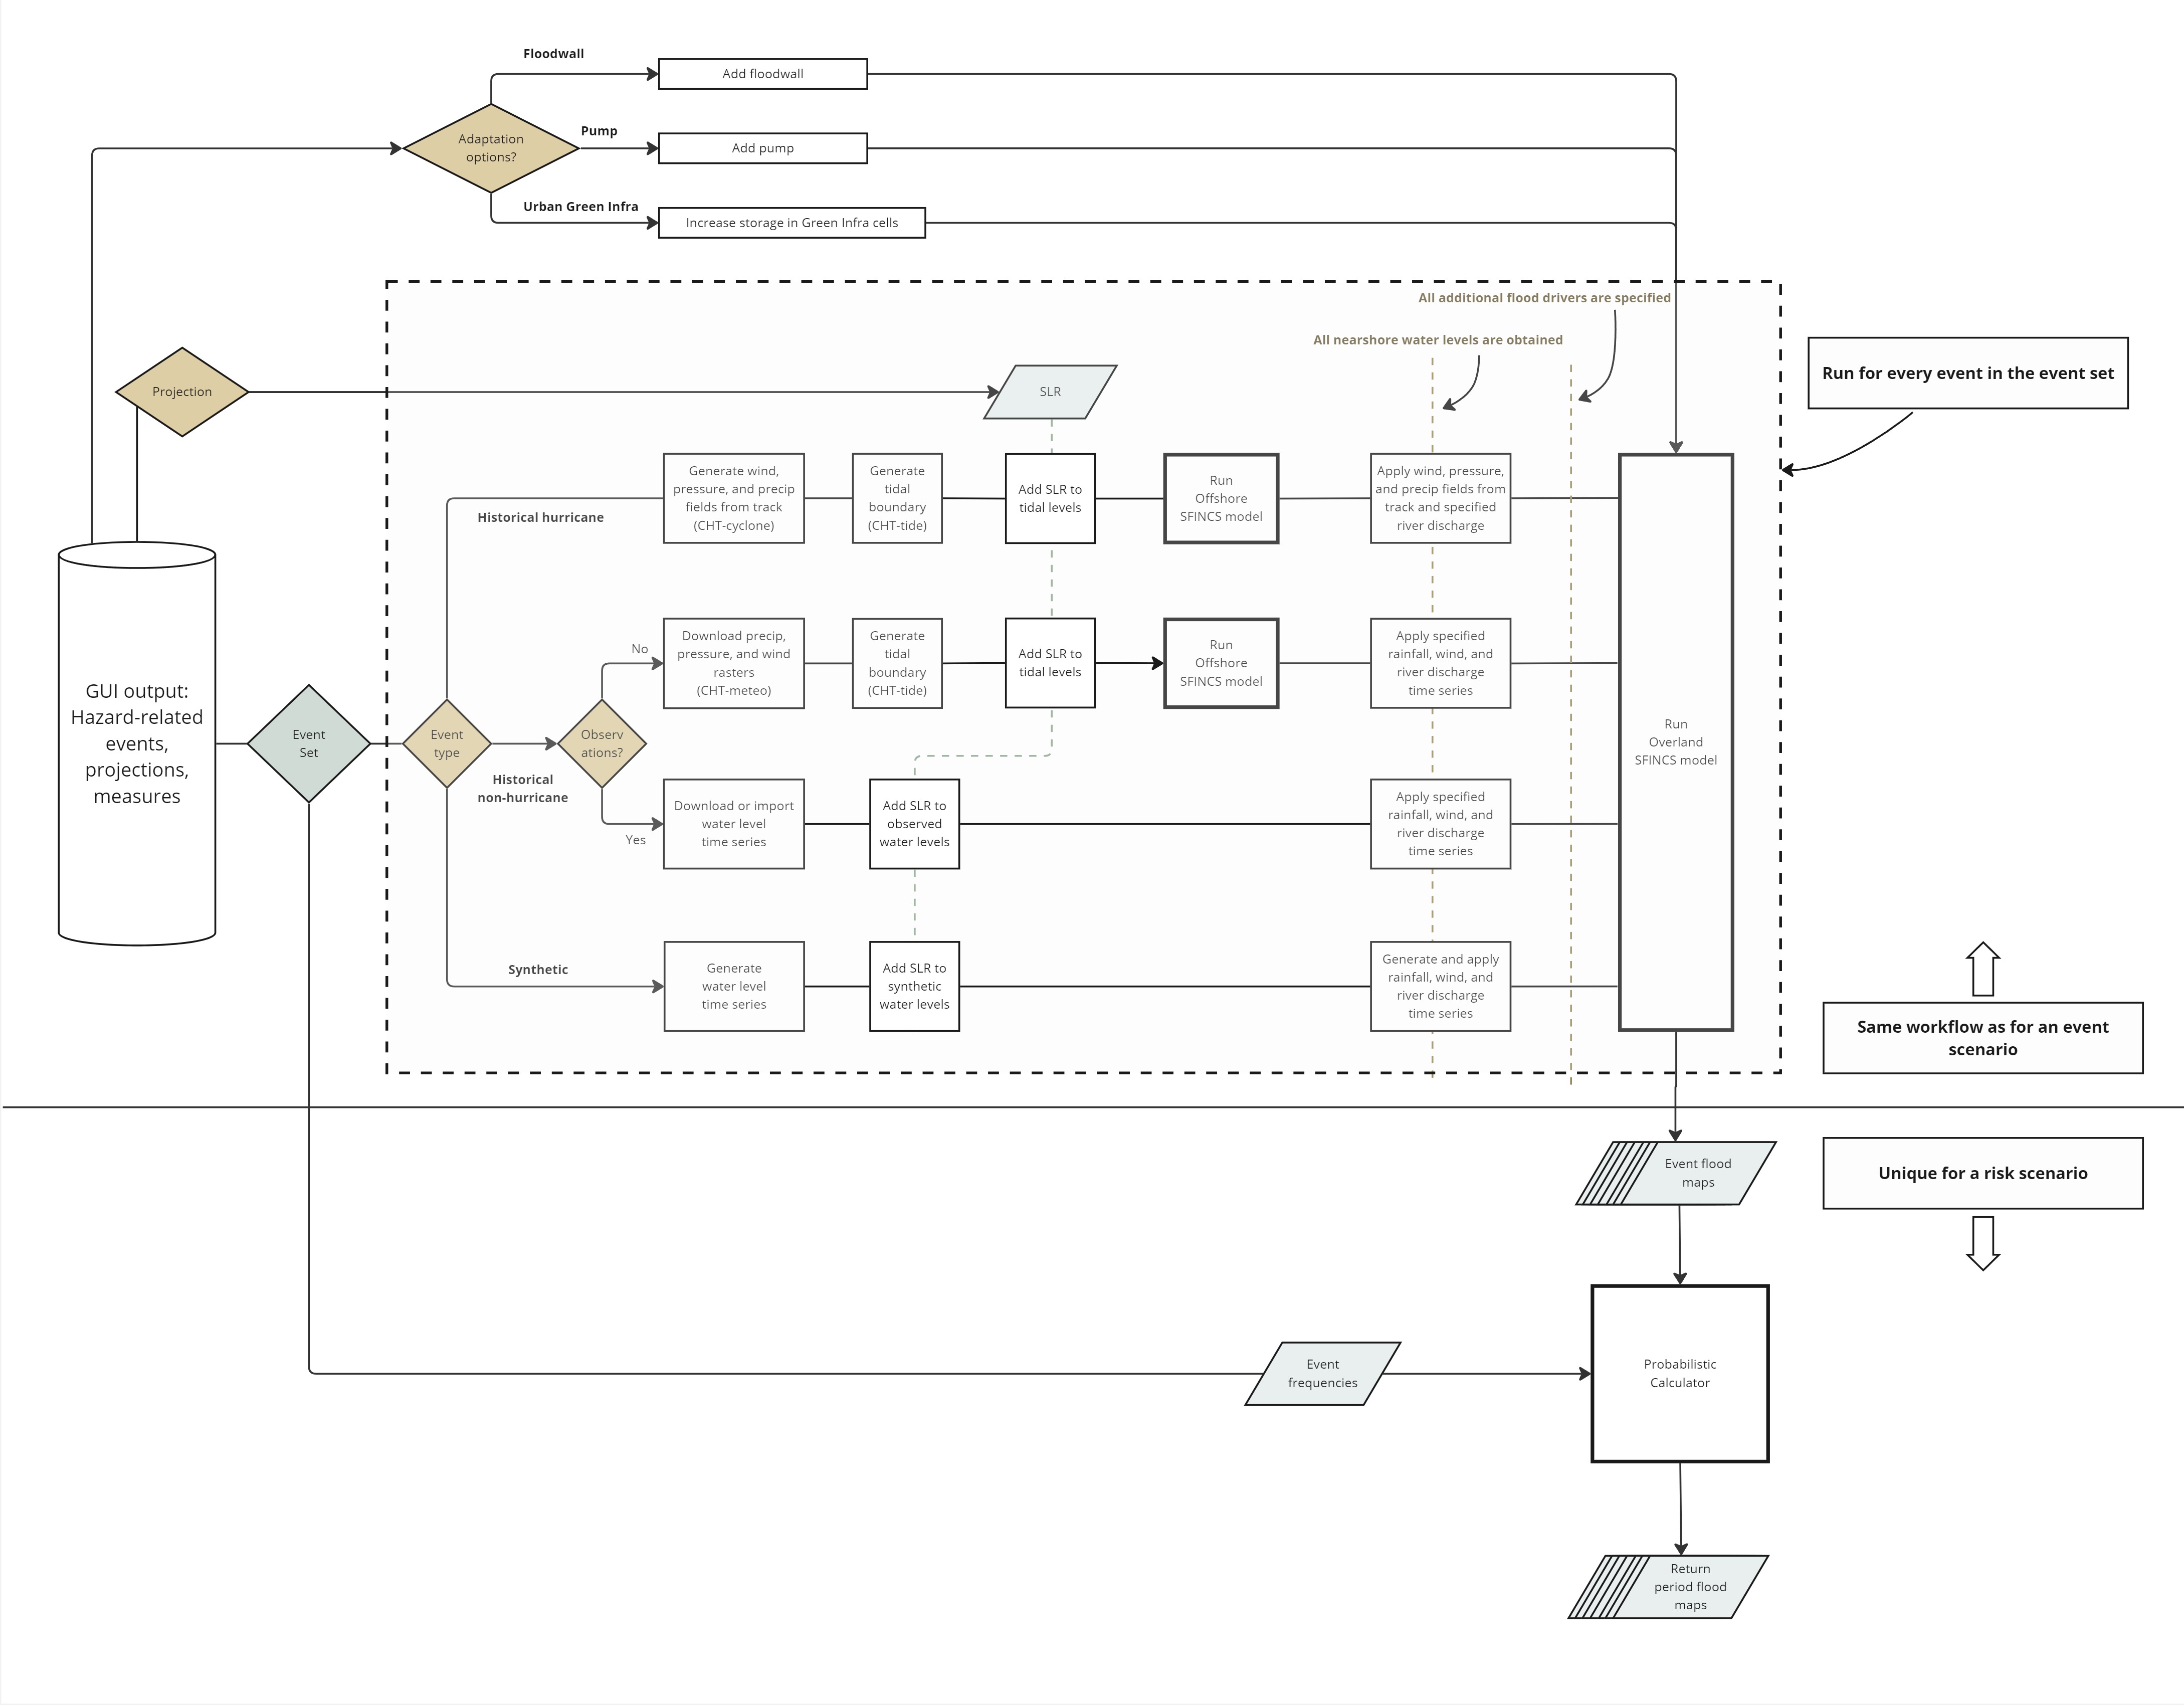
Figure 1 zooms in on the hazard calculation portion of the FloodAdapt workflow for a risk scenario. Referring to the figure can support the description of the calculation.
For a risk scenario the hazard calculation involves both simulating the flooding for each event in the event set and the derivation of probabilistic return period maps. FloodAdapt modifies the SFINCS model based on adaptation options and calculates the flooding for each event in the event set in the same way it does for an event scenario. This is indicated in Figure 1 by a horizontal line, above which the event scenario and risk scenario are the same, except that the flood model is called multiple times to calculate flooding for each event in the event set. This workflow is described in the event scenario documentation and not repeated here. Below the horizontal line in Figure 1, the workflow for the risk scenario hazard is unique. Once the simulation for each event in the event set has been completed, the entire set of flood maps is passed into a probabilistic calculator. This is a routine that uses the event frequencies and simulated flood maps to create a water level-frequency curve for each grid cell in the flood model. It then derives from this curve the flood depth for the return periods specified for the site at system setup. From this output it creates gridded return period flood maps. A detailed description of the probabilistic calculator is given later on this page.
Impact and risk calculation
Figure 2 zooms in on the impact and risk calculation portion of the FloodAdapt workflow for a risk scenario. Referring to the figure can support the description of the calculation.
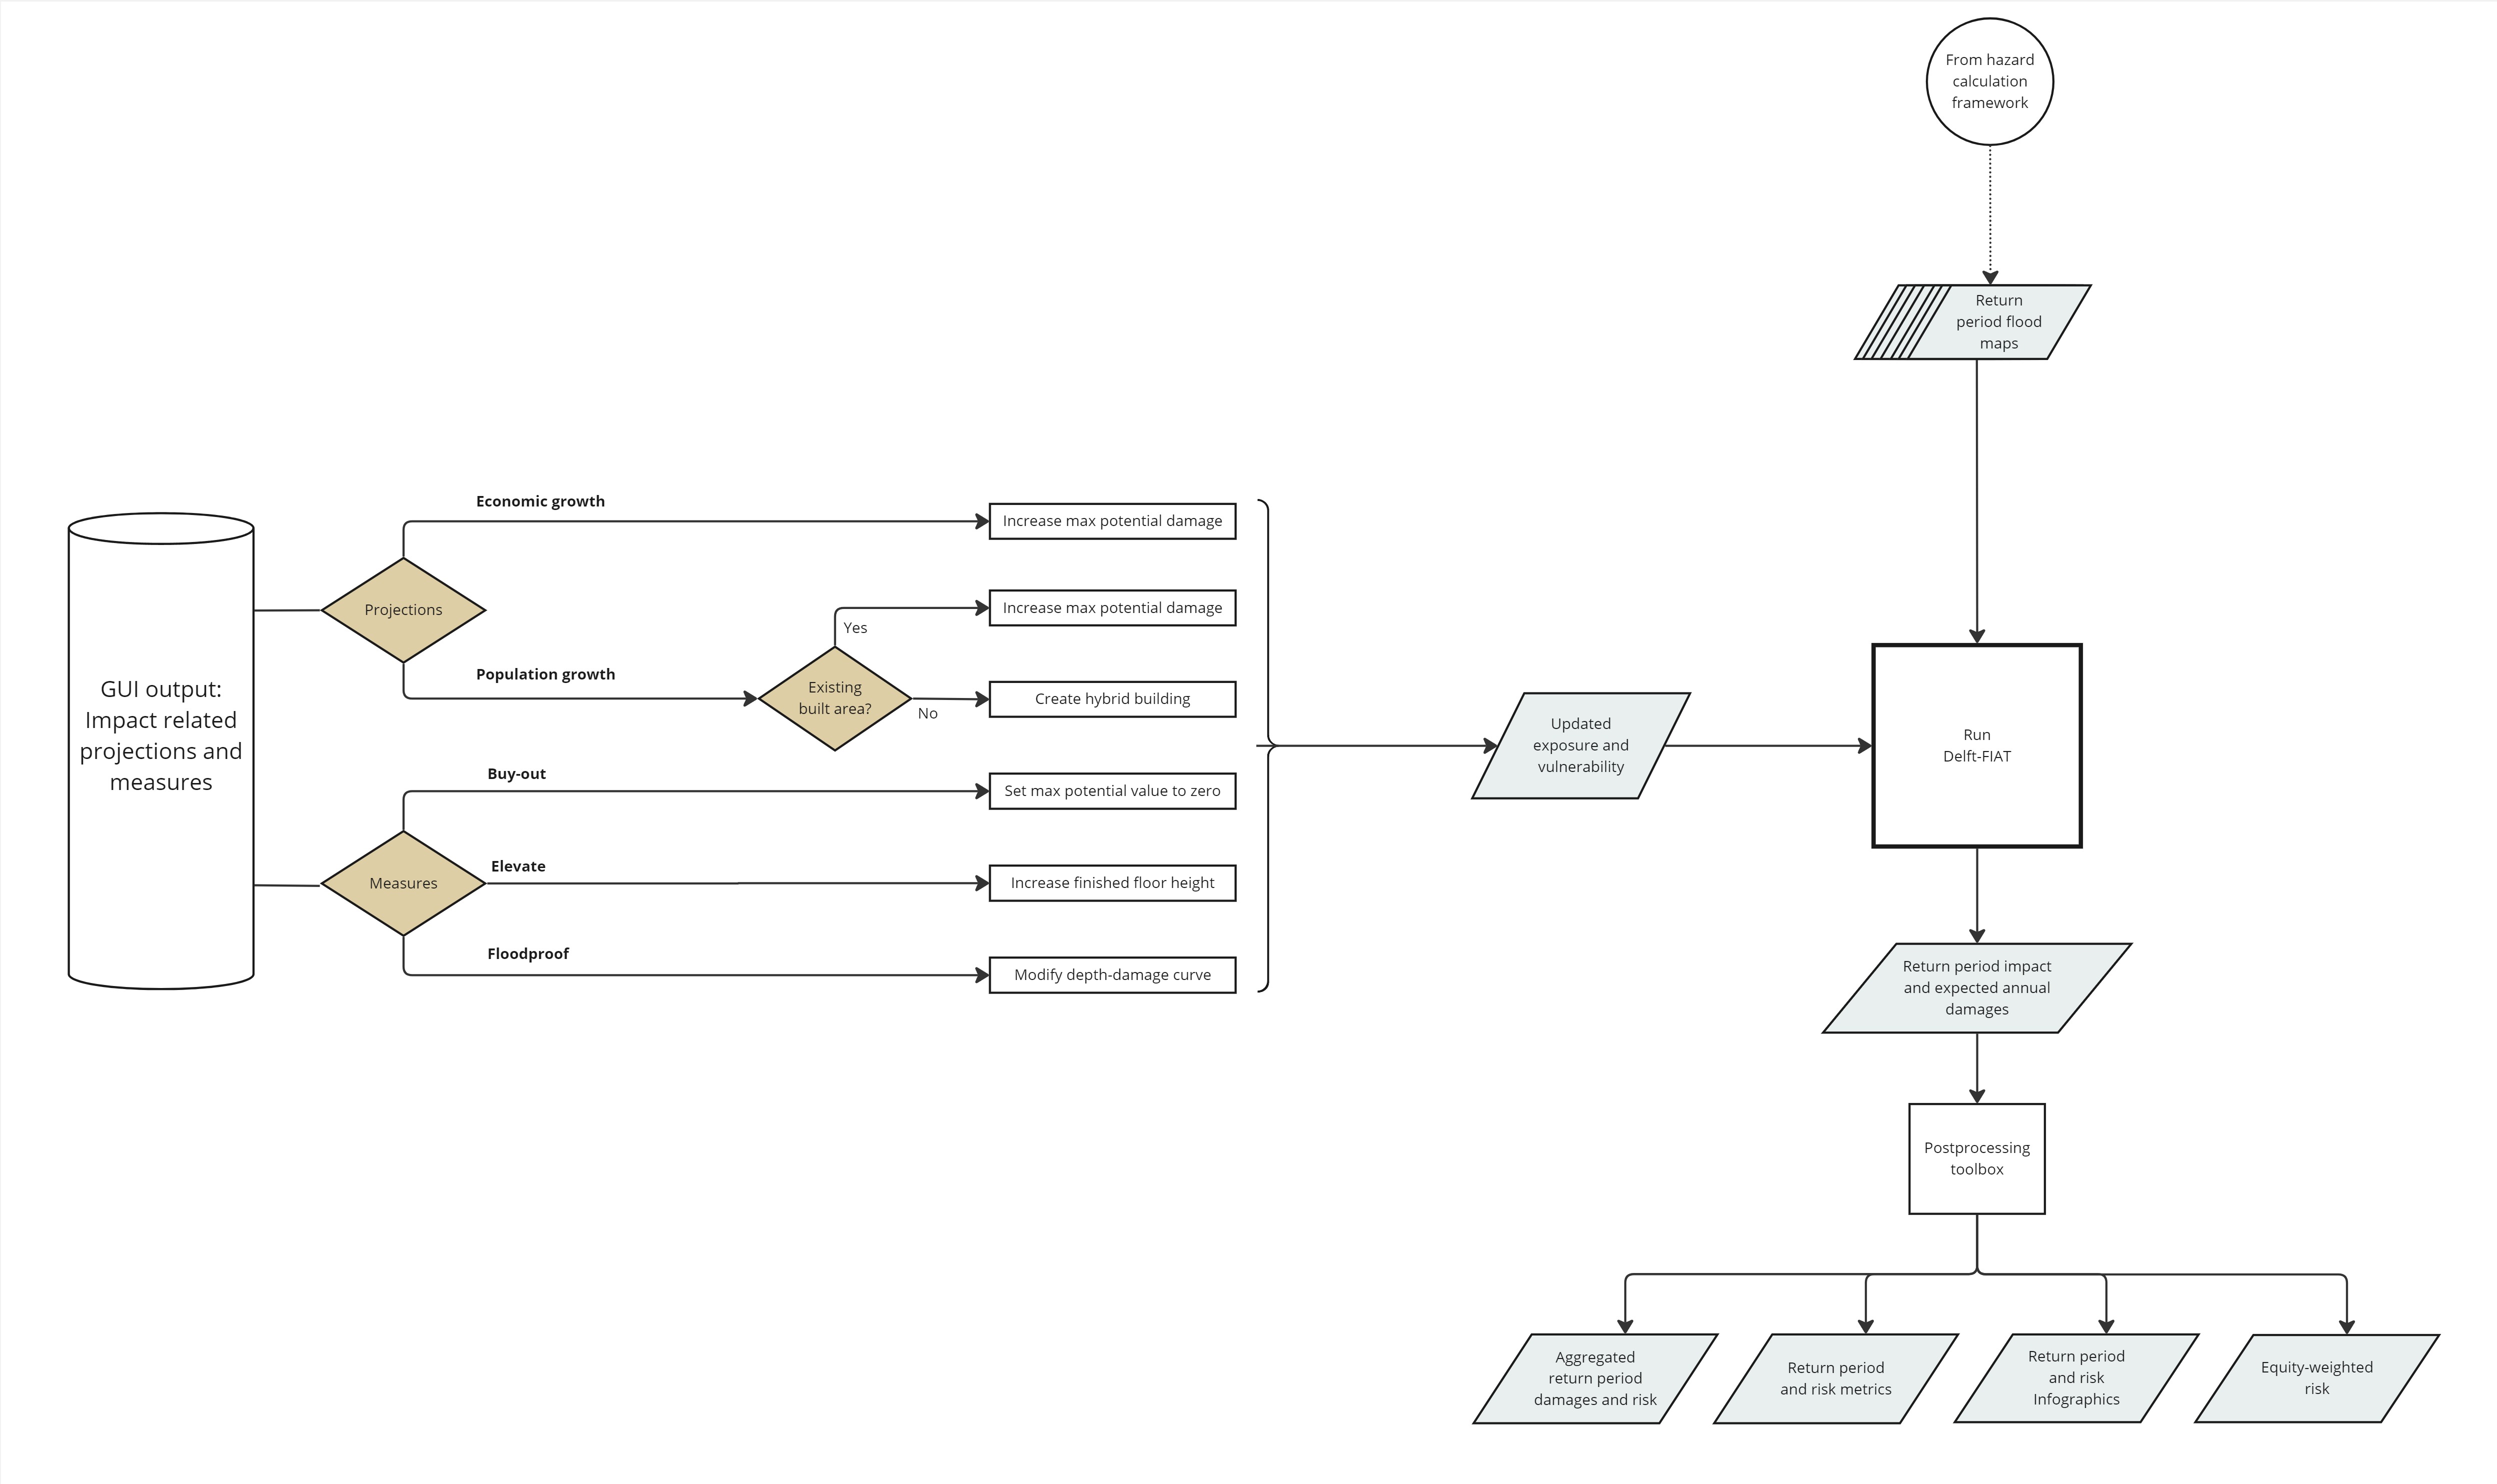
The automatic updating of the Delft-FIAT model based on user-specified adaptation options and projections is identical to the handling in the event scenario. This workflow description is not repeated here.
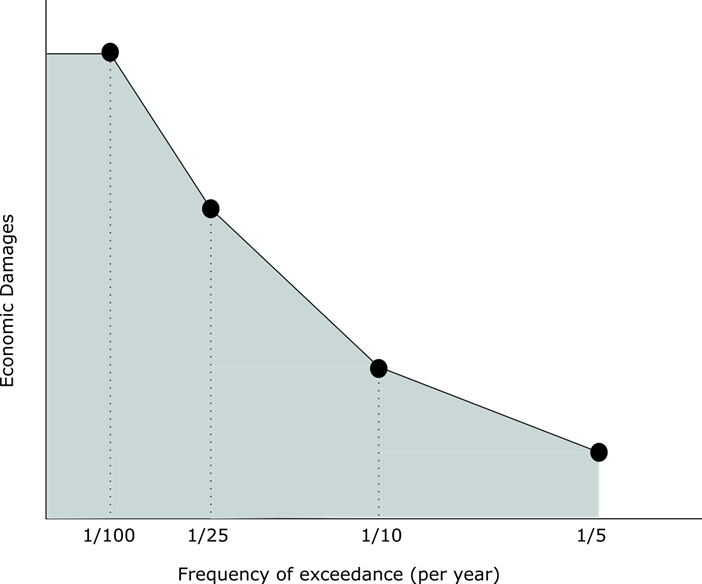
For a risk scenario, FloodAdapt imports into Delft-FIAT the set of return period flood maps (calculated in the hazard framework with the use of the probabilistic calcultor). Delft-FIAT has an automatic risk module built in which calculates and outputs the direct economic damages to the assets in the exposure data for each input return period flood map. It uses this output to generate a damage-frequency curve (note that the exceedance frequency is the reciprocal of the return period). The expected annual damages (risk) are then calculated as the area under the damage-frequency curve (see Figure 3). The set of return periods will be finite, so Delft-FIAT makes approximations for return periods beyond what is calculated. For return periods higher than the highest calculated, it assumes economic damages equal to the highest calculated. For return periods lower than the lowest calculated, it assumes economic damages of zero. In FloodAdapt, users can choose the return periods for which damages will be calculated, to minimize these approxmiations. For example, users can take an upper limit for the return period of 500 or 1000 years and a lower limit of 1 year.
After the return period damages and risk have been calculated by Delft-FIAT, FloodAdapt sends the output through a suite of postprocessing scripts to derive aggregated damages, spatial maps, risk metrics, and risk-related infographics. Additionally, FloodAdapt calls an Equity routine that calculates equity weights and applies them to risk estimates at an aggregated level for optional viewing in the user interface.
The probabilistic calculator
In Figure 1, the simulated flood maps for the events in the event set, and the event occurrence frequencies, are passed into a module called “The probabilistic calculator”. This section describes the method in that calculator to determine return period flood maps. The following steps are carried out for each grid cell in the SFINCS overland model. Each step is described below with supporting images.
- Step 1: Arrange water levels and frequencies in tables
- Step 2: Sort the water levels in descending order
- Step 3: Calculate the frequency of exceedance of the water levels
- Step 4: Calculate the return periods of the water levels
- Step 5: Calculate the water level associated with the return periods of interest
- Step 6: Convert water levels to water depths
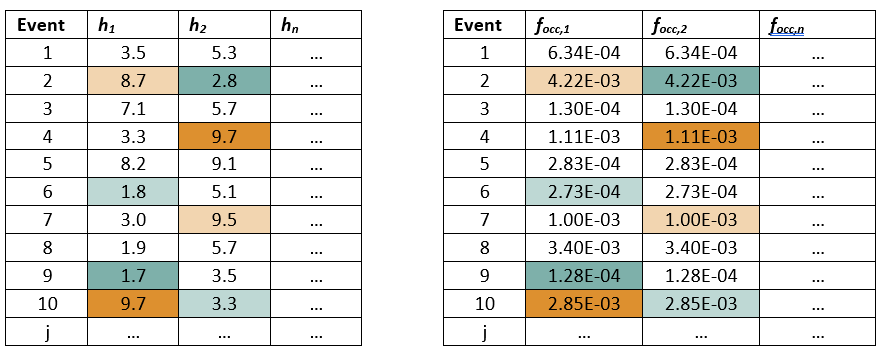
Step 1: Arrange water levels and frequencies in tables
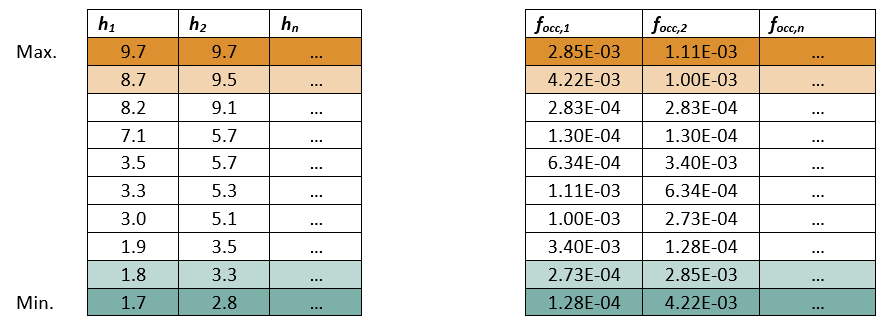
The water levels for each grid cell (h) and their associated frequencies of occurrence (f) are arranged in two separate matrices with the number of rows equal to the number of events (j) and the number of columns equal to the number of grid cells (n). The example shown in Figure 4 illustrates the results for two fictitious grid cells and 10 fictitious events. To allow the reader to follow the approach more easily, the two highest and lowest values and their associated frequencies are highlighted in orange and blue throughout all steps.
Step 2: Sort the water levels in descending order
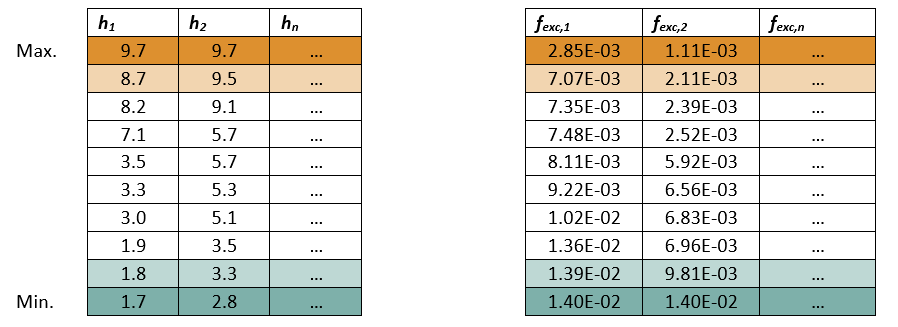
The water levels are sorted column-wise in descending order (see Figure 5). The matrix with the frequencies of occurrence are sorted in the same manner so that the frequency of occurrence has the same location in the right matrix as its corresponding water level value in the left matrix. The highest water level does not necessarily correspond to the lowest frequency of occurrence as in the example below.
Step 3: Calculate the frequency of exceedance of the water levels
To calculate the frequencies of exceedance, the CFRSS cumulatively sums the frequencies of occurrence column-wise from the highest to lowest water level (see Figure 6). In the example, the frequency of exceedance for grid cell n=2 in the second row is 2.11E-03. This is the sum of the frequencies of occurrence of the first two rows from Table 6.4 (1.11E-03 + 1.00E-03).
Step 4: Calculate the return periods of the water levels
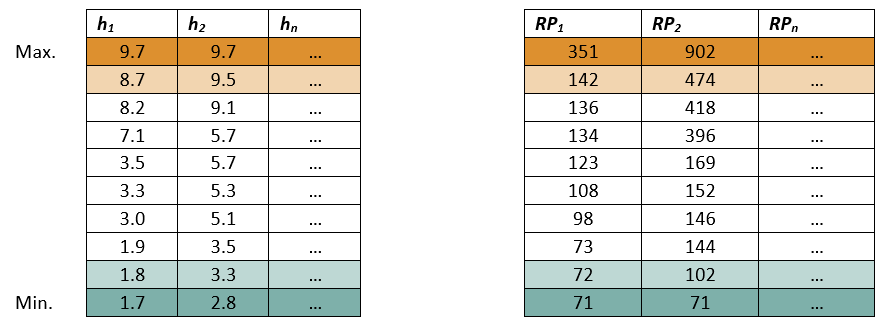
The return periods of water levels in each grid cell are then calculated as the inverse of the frequencies of exceedance (RP = 1/fexc); see Figure 7.
Step 5: Calculate the water level associated with the return periods of interest
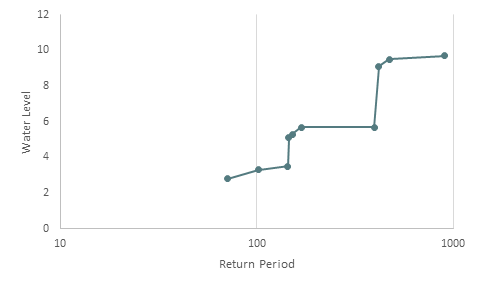
To calculate the water levels for the return periods of interest specified in the site configuration file, FloodAdapt uses the “lookup-table” from Step 4 (Figure 7) to derive the water level associated with each return period. The water levels in the lookup table are log-linearly interpolated between the return periods (see Figure 8 for an illustration).
For extrapolation outside of the bounds of the minimum and maximum return period in the lookup table, the following rules are applied:
- If the return period of interest is larger than the maximum return period calculated for a given grid cell, the water level of the maximum return period is assigned to the return period of interest.
- If the return period of interest is smaller than the minimum return period calculated for a given grid cell, the water level is set to zero in that grid cell for the return period of interest.
Step 6: Convert water levels to water depths
The resulting return-period water levels for each grid cell are mapped onto the raster of the (typically finer-scale) DEM using the indices file that maps each SFINCS grid cell to its corresponding DEM raster cells. The land elevation is then subtracted from the water levels to obtain flood depths. These flood depth maps are then passed to the Delft-FIAT model to calculate impacts and risk.