Synthetic events
Synthetic events allow users to create a wide array of different types of events, without needing to have any recorded data. Each event component - water levels, wind, rainfall, and river discharge - can be specified using synthetic curves. This documentation walks the user through the different options.
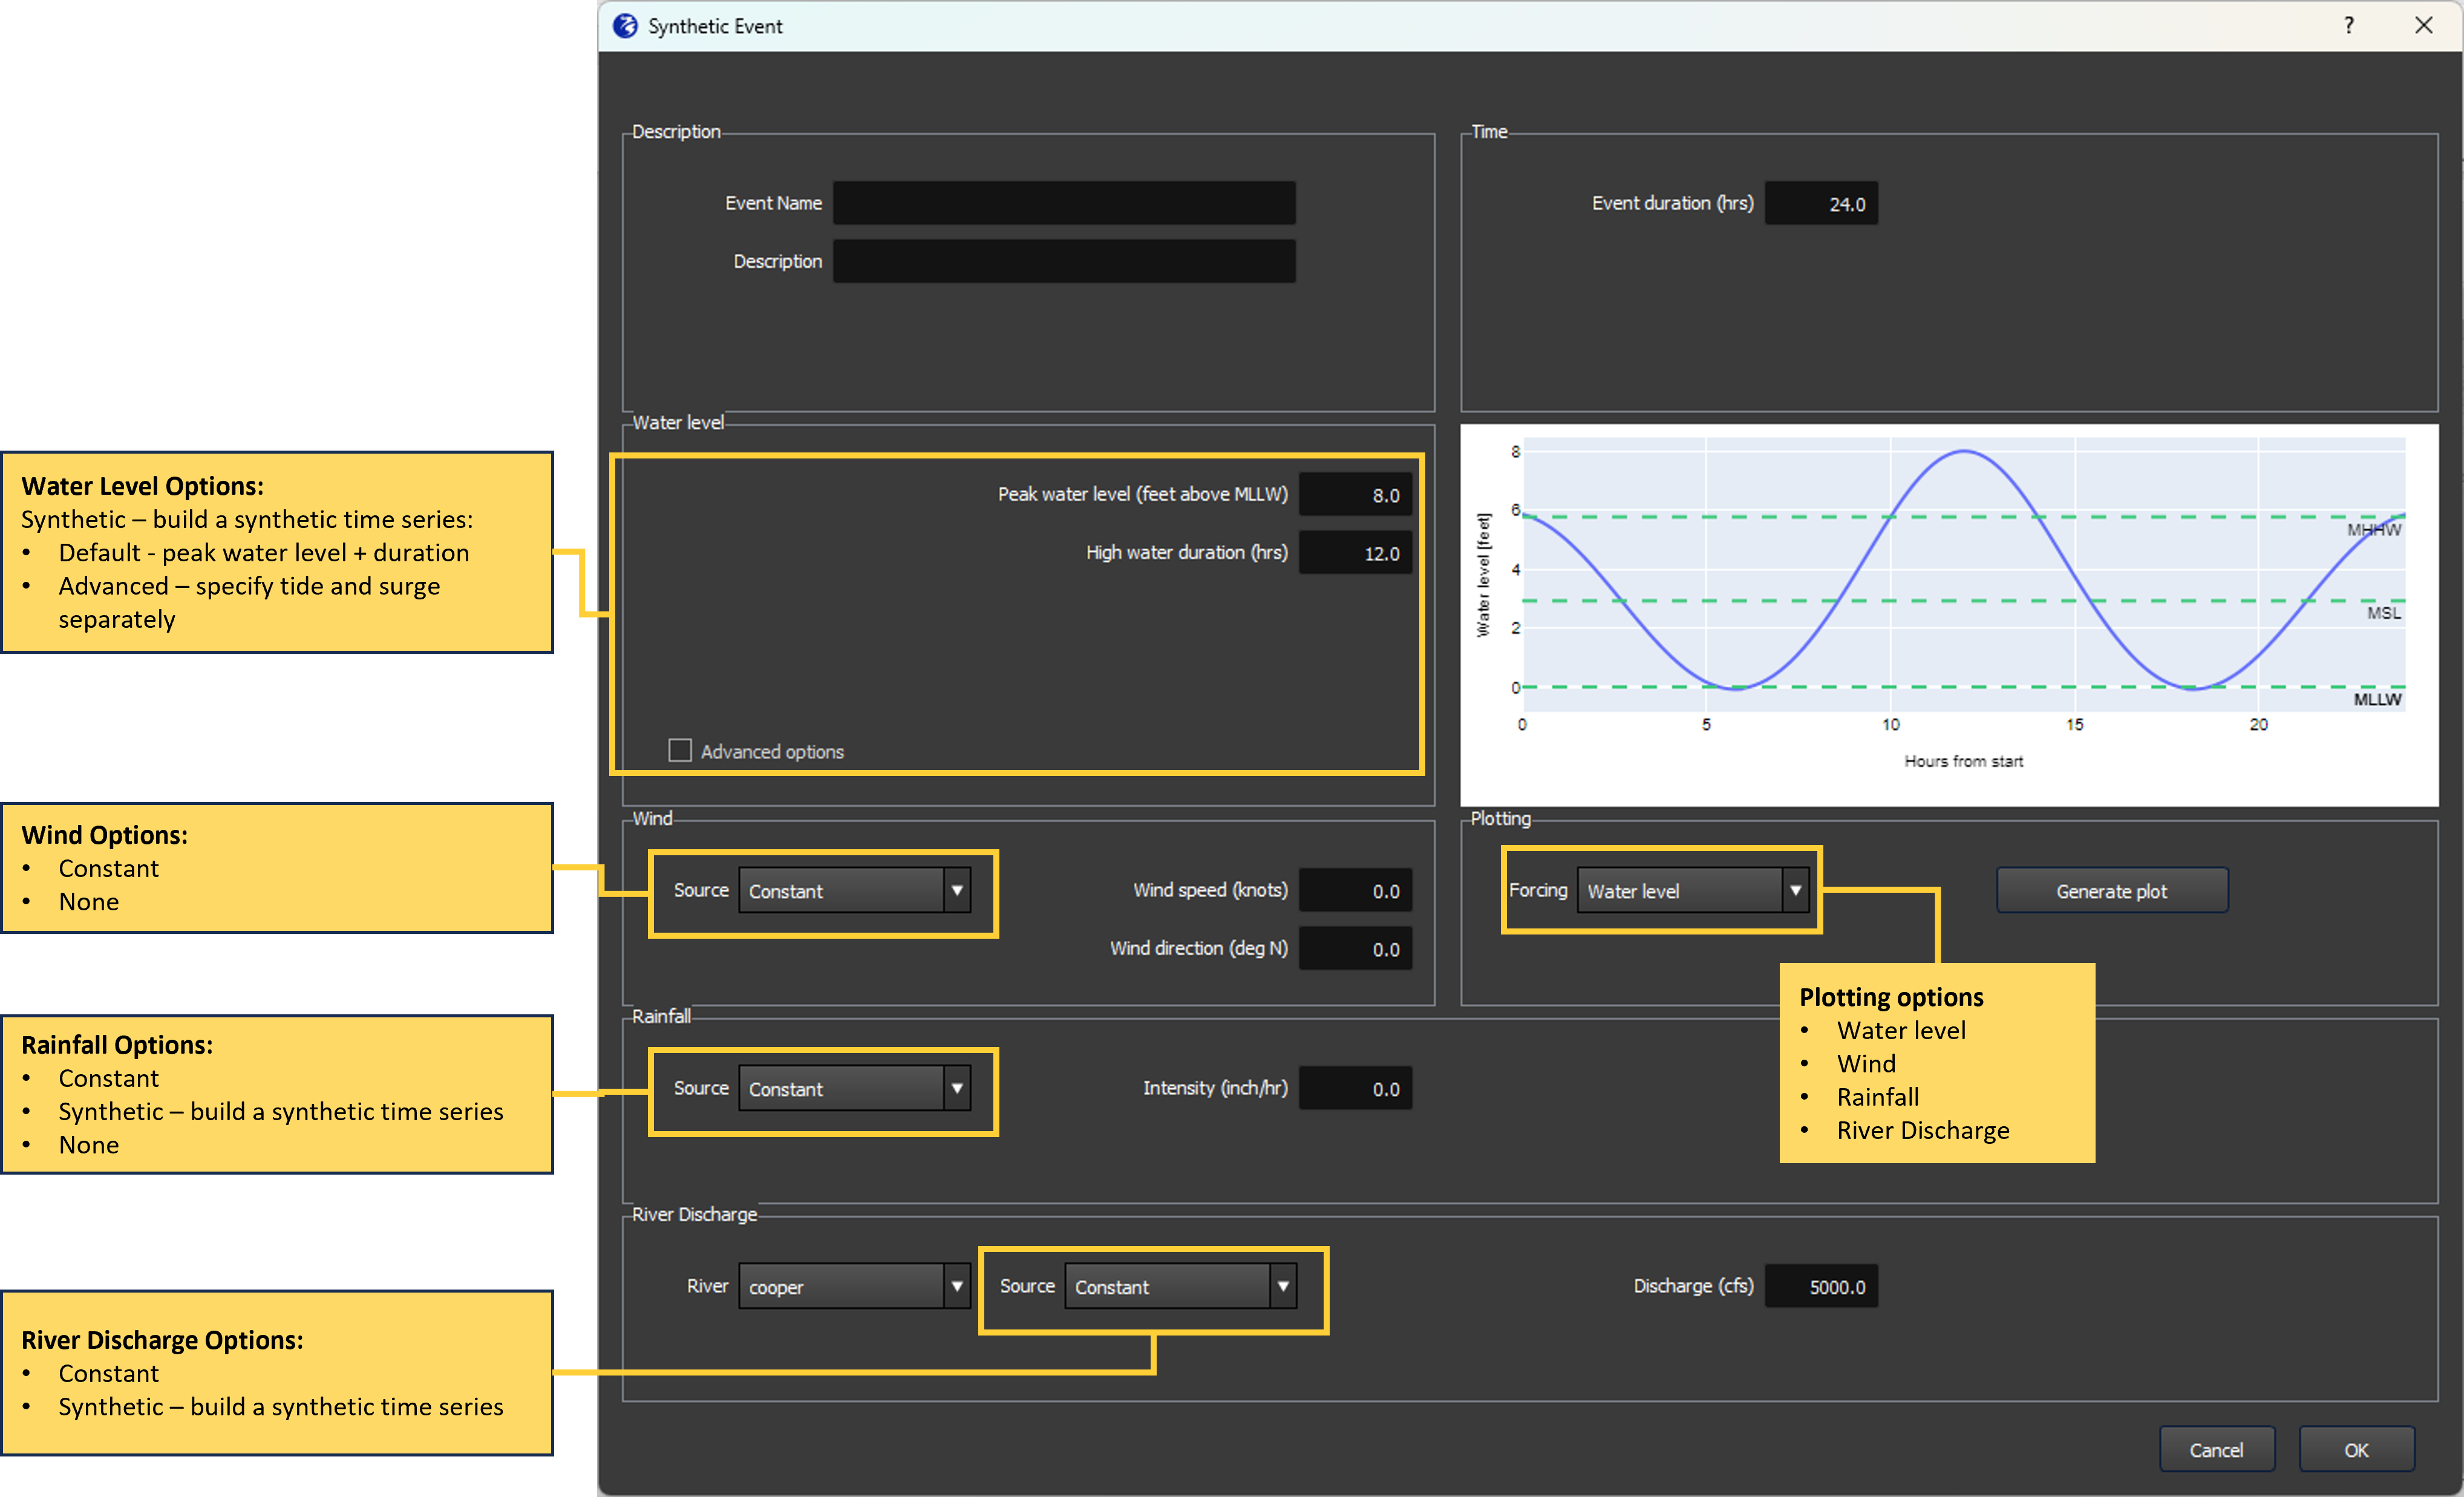
When the user selects the “Synthetic” option from the Events tab, they will see the event template window shown in Figure 1. This window allows the user to input synthetic time series for:
Water level
For a synthetic event, there are two options to specify the water level time series: a simple option, and an advanced option. The simple option is what is shown by default in the event template window (Figure 1). The user only has to specify a peak water level (combined tide and surge) and the duration of the high water. For example, if average high tide is 6 ft + MLLW, a user might select 8 ft MLLW as a peak, with a duration of 12 hours. This superimposes a Gaussian surge of 2 ft with a 12 hour duration on top of the regular tidal series. The simple option always imposes the surge peak at the same time as high tide.
The advanced options appear when a user clicks the ‘Advanced options’ checkbox (see Figure 2). The user then can modify the tide and surge components separately. The tidal time series is defined by an amplitude above or below mean sea level, and a peak time which specifies when the high tide should occur relative to the start of the event. By default the peak time will be the midpoint of the event. The surge is specified by a ‘shape’ which can be a Gaussian, triangular or block shaped curve, the peak surge, the duration of the surge, and the timing of the surge peak relative to the start of the event. In general, the simple option is expected to suffice in most cases. In some cases, for example if a user wants to explore the sensitivity of the timing of a surge peak relative to high tide, the advanced options would be useful.
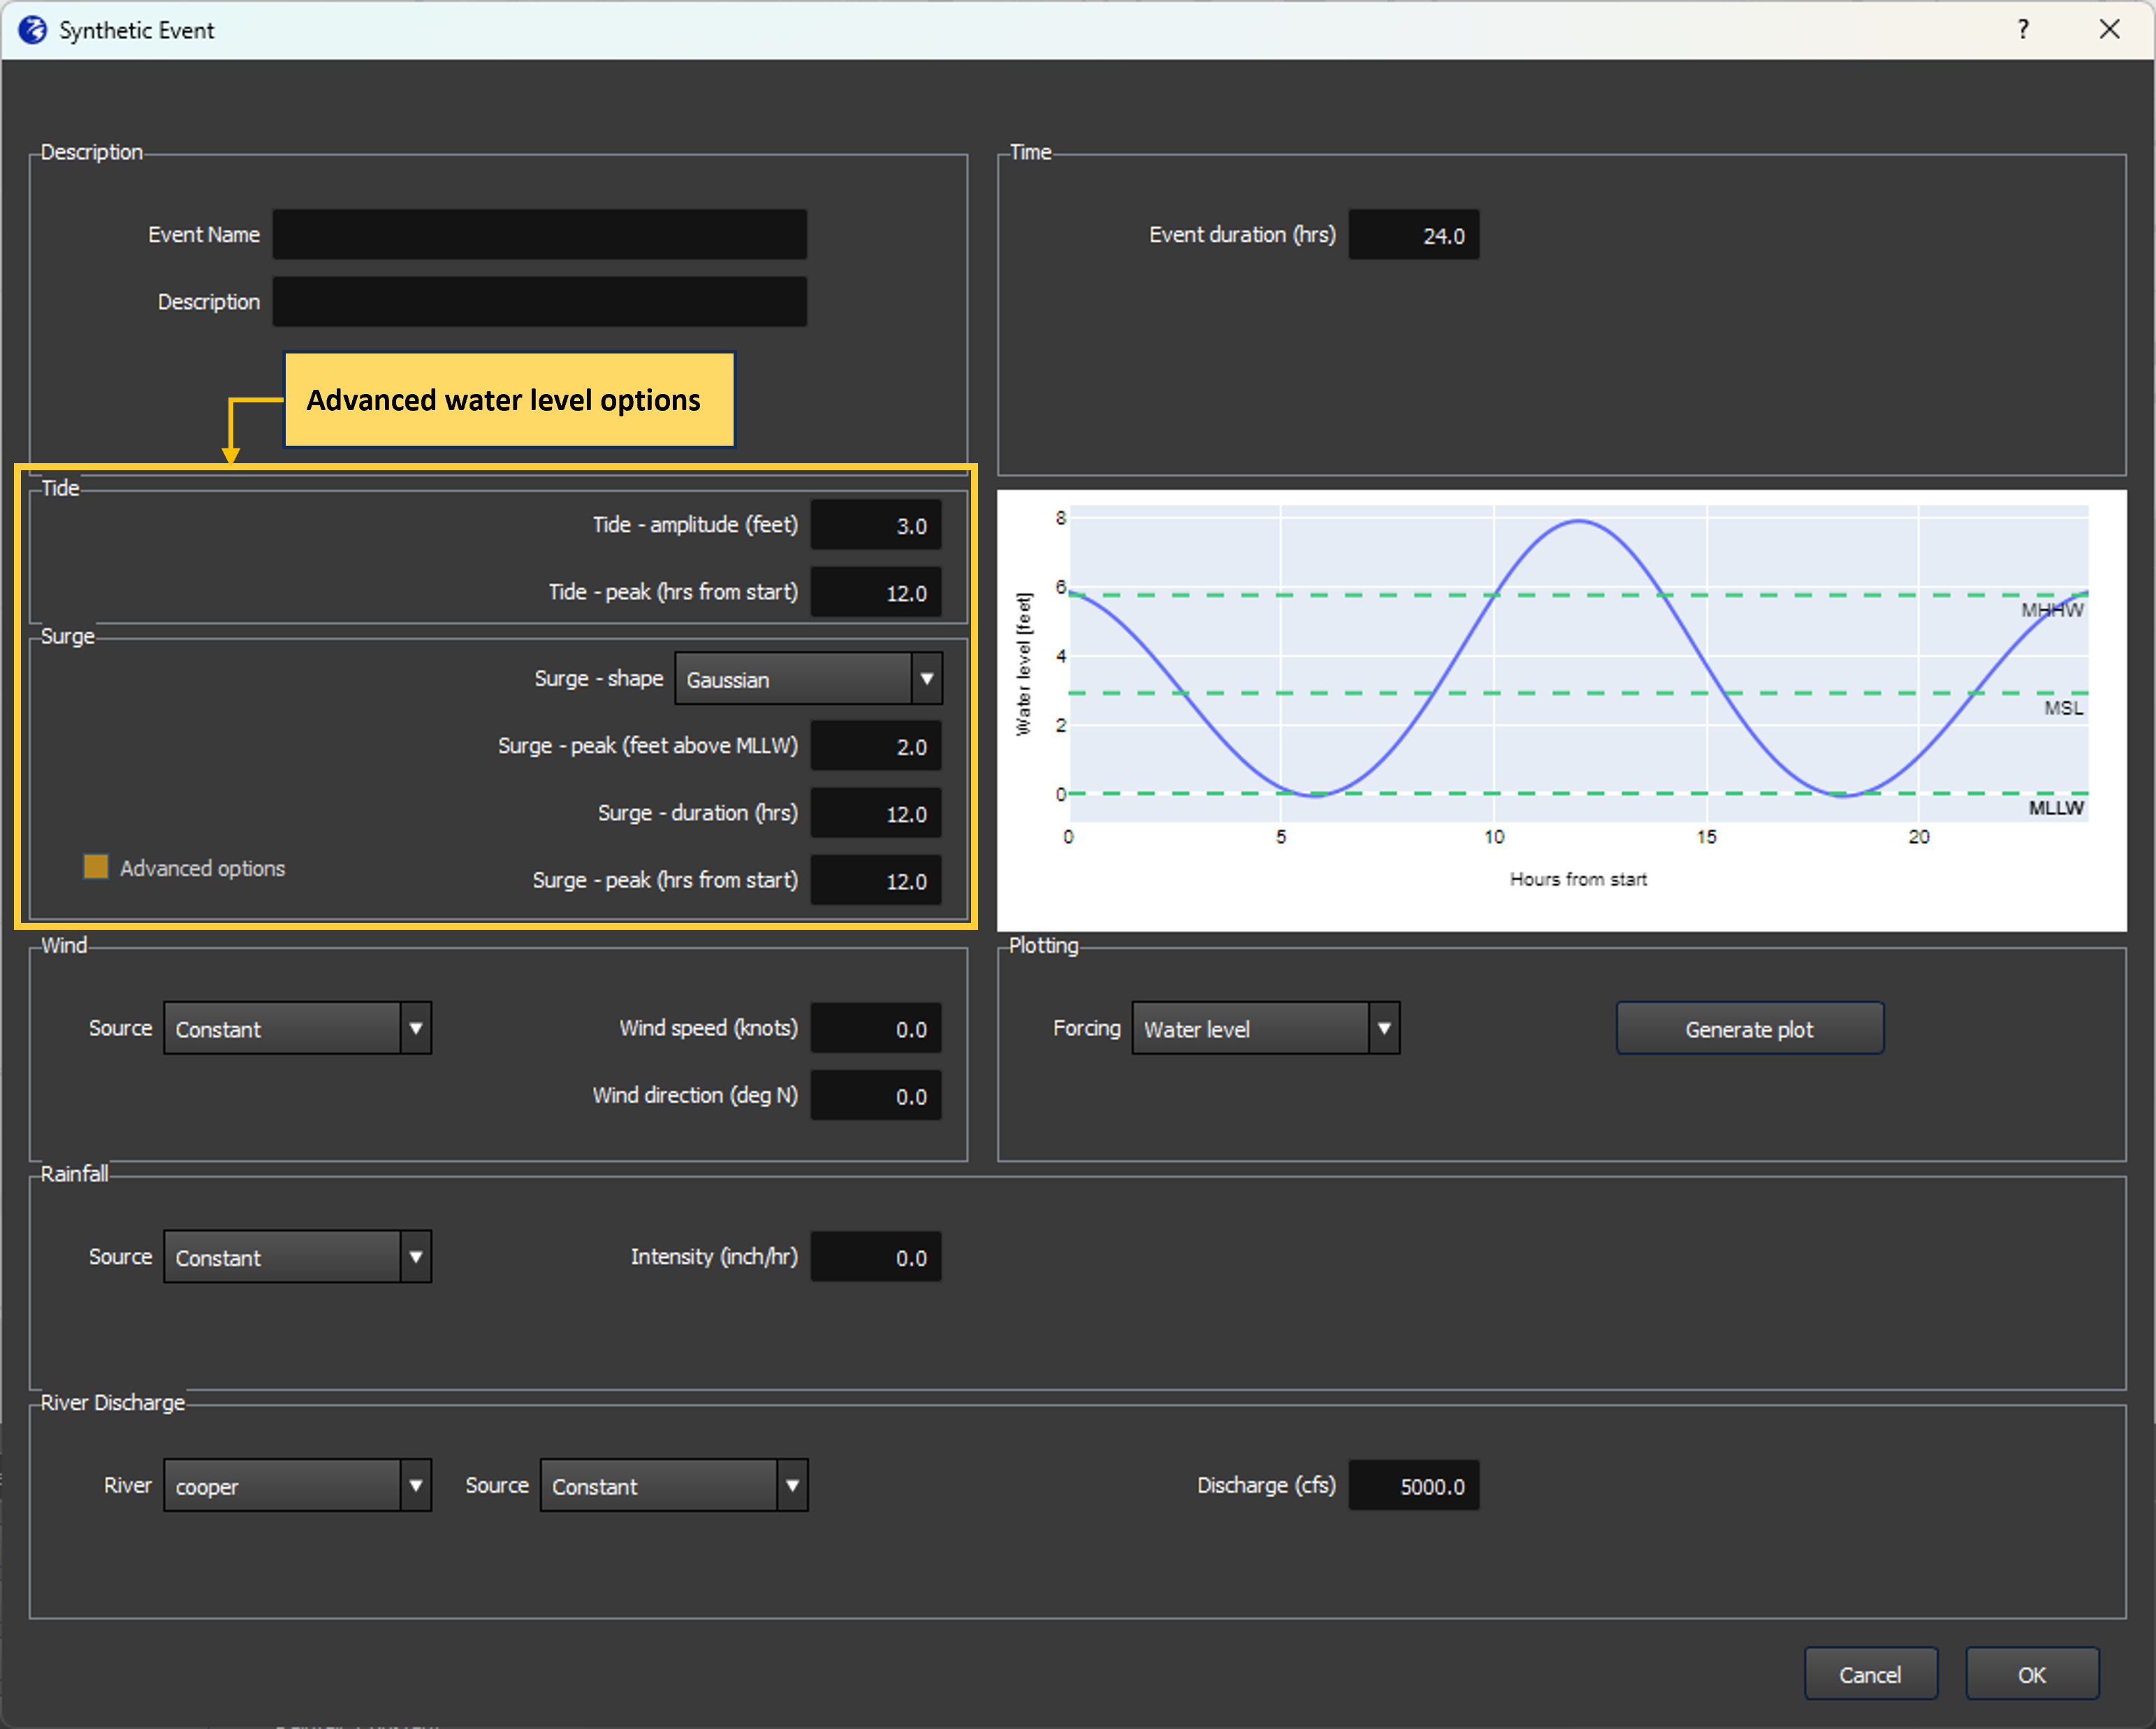
There are several datums shown in the water level plot (see Figure 1 or Figure 2): mean lower low water (MLLW), mean sea level (MSL), and mean higher high water (MHHW). These datums, as well as the reference level (the ‘zero’ in the plot), are configurable and chosen at system set-up to be most intuitive for the intended users of the system.
Rainfall
For a synthetic event, users can choose none, a constant intensity that will be applied over the entire duration of the event, or a synthetic rainfall (time series) curve.
Rainfall curves
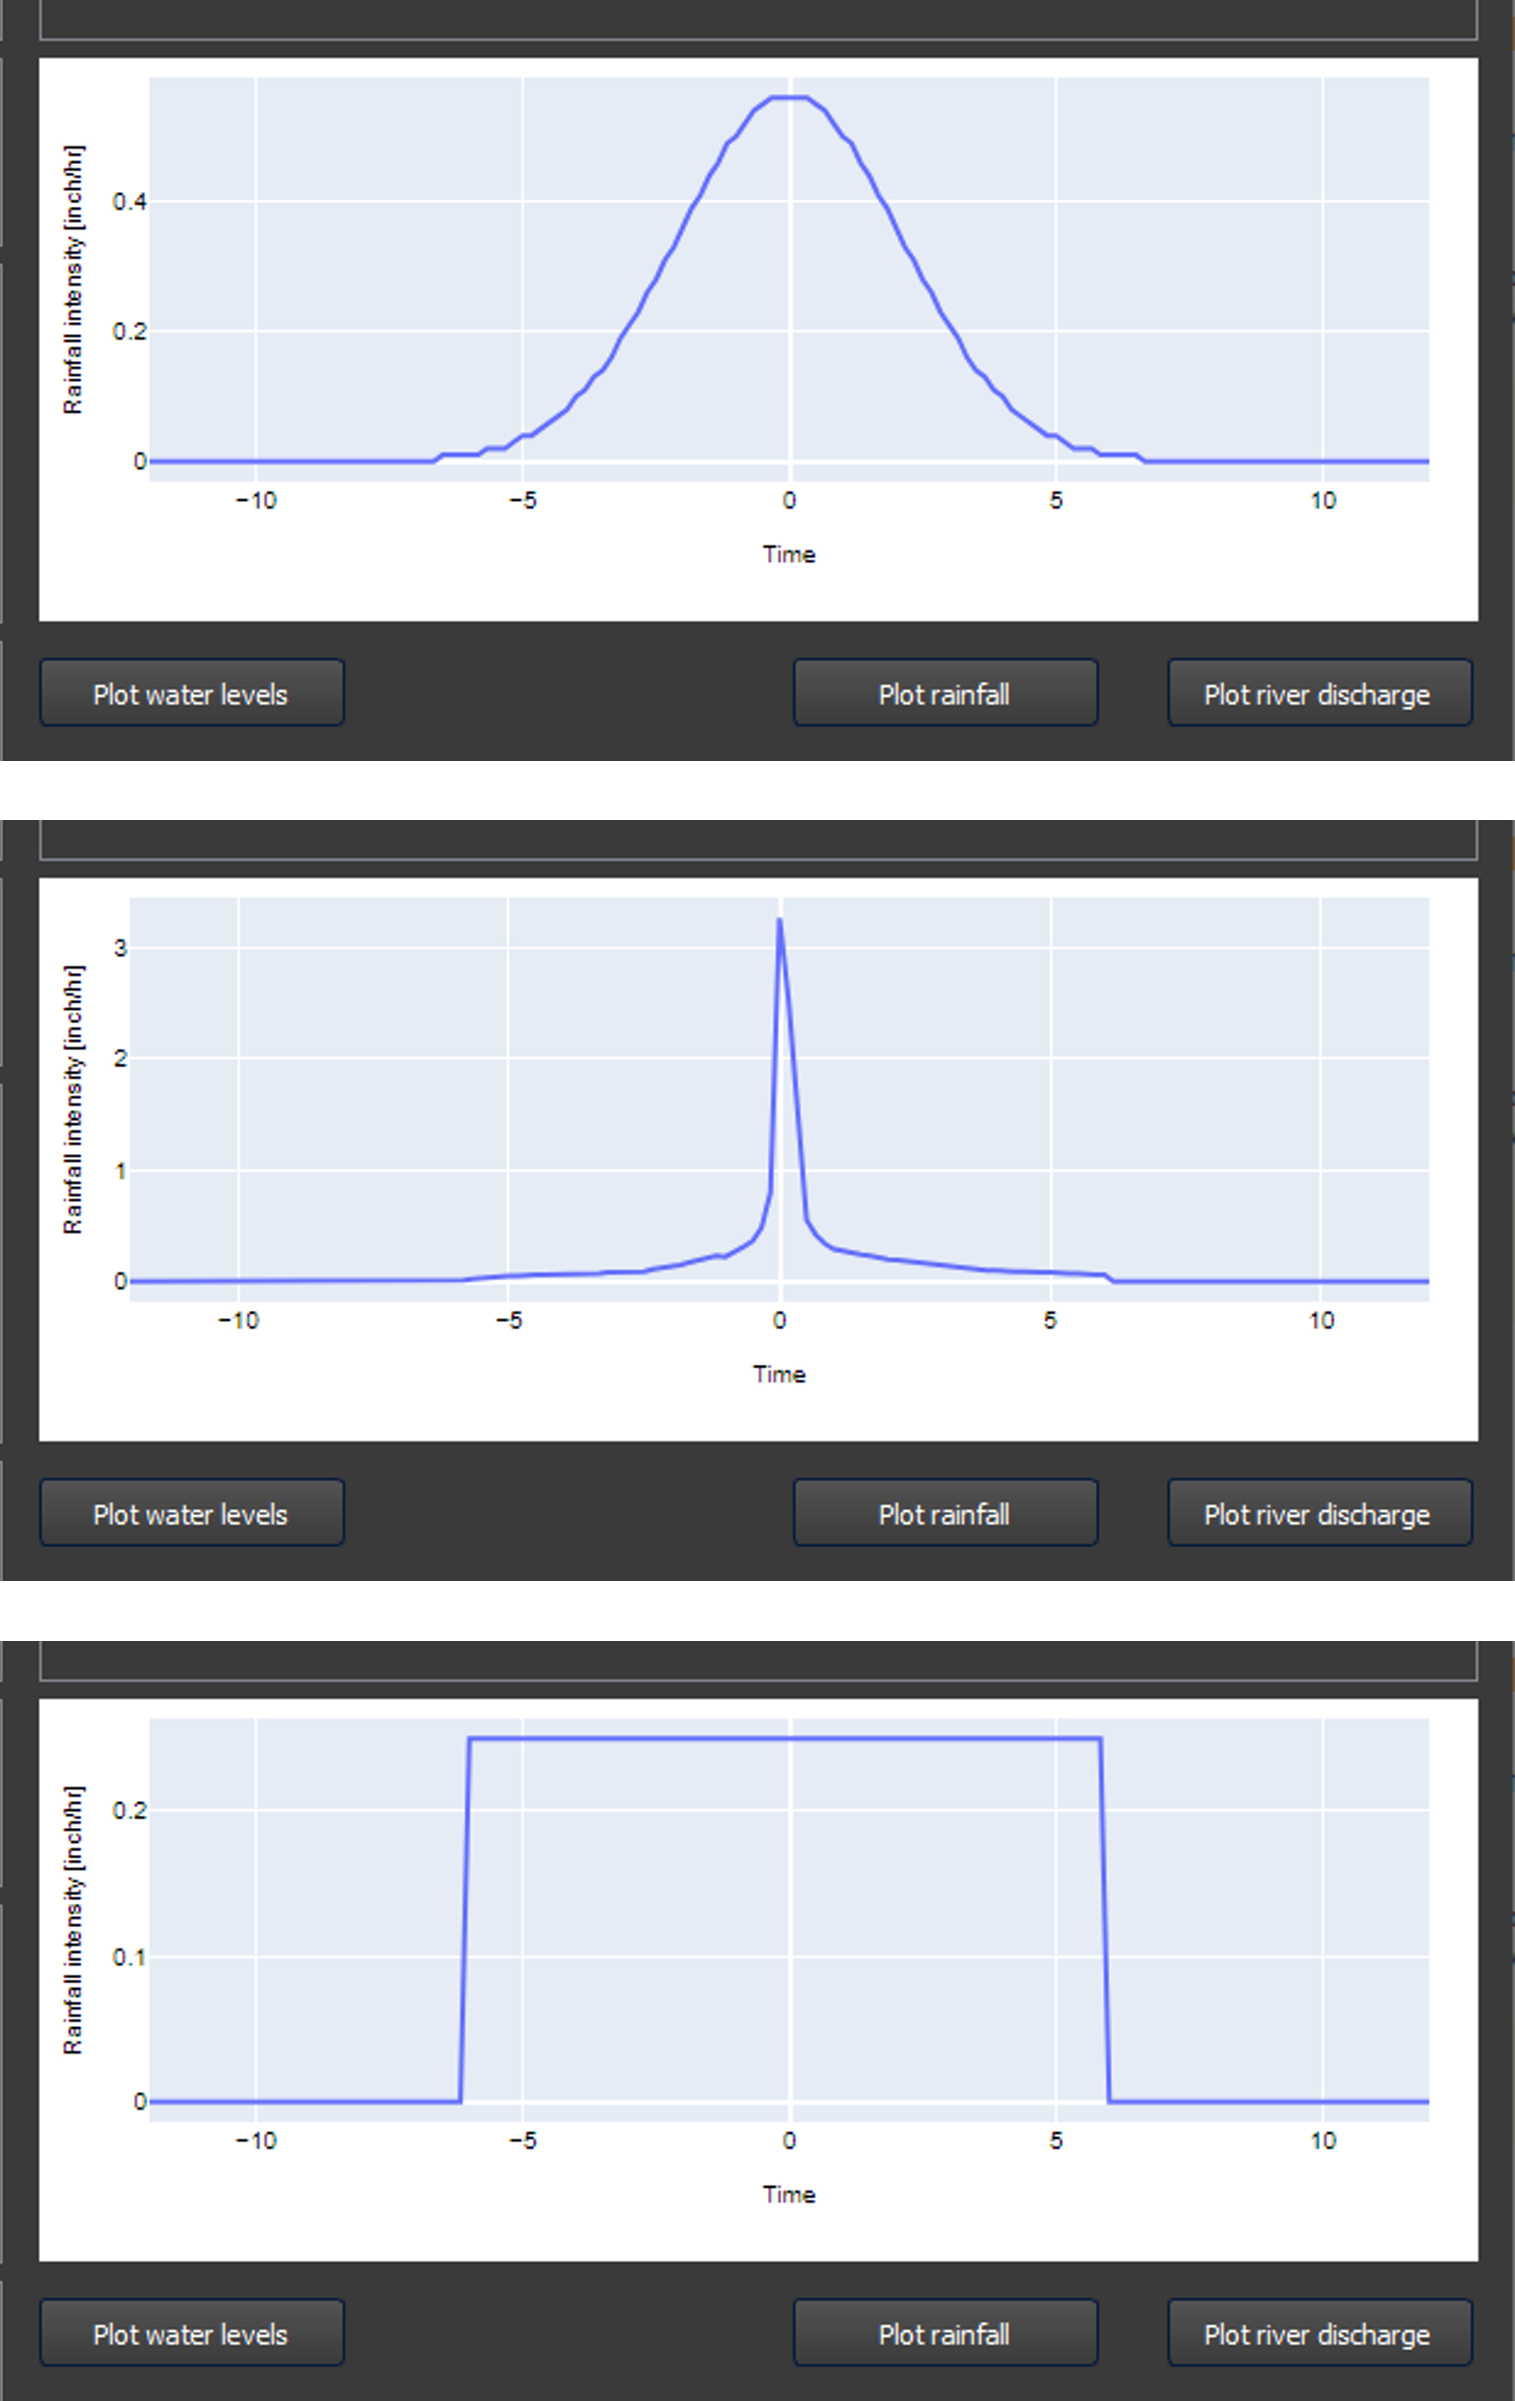
There are four rainfall curves that a user can select to specify the rainfall time series. In each case, the user specifies the cumulative rainfall, the duration of the rainfall and the peak time of the rainfall relative to the start of the event.
Gaussian - the rainfall time series is based on a Gaussian curve.
SCS - These curves, often used in practice in the US, were developed by the Soil Conservation Service (SCS), now known as the National Resources Conservation Service. They have a more peaked nature than a Gaussian curve and therefore represent a more intense rainfall event. There are three SCS rainfall curves for different parts of the US. The curve that a user can select in the event teplate window will already be configured for the site location (part of system set-up).
Block - the rainfall time series has a rectangular shape.
Triangle - the rainfall time series has a triangular shape.
Wind
For a synthetic event, the user can only enter either none or a constant wind speed. When entering a constant wind speed, the user is asked to enter both the wind speed and wind direction. The direction should be entered in nautical degrees. This represents the direction where the wind is coming from. A direction of 0 degrees means wind is blowing from the North, 90 degrees means wind is blowing from the East.
River discharge
The river discharge represents the discharge time series in a river at the model boundary. If there are multiple rivers at the model boundary, the user will be able to select each river to specify the discharge. The user has two options for specifying the river discharge: a constant discharge or a synthetic time series.
Constant - A constant discharge is the default option. An average discharge value is filled in, which is specified in a FloodAdapt configuration folder at system setup. The user can change the value of the constant discharge.
Synthetic - The synthetic option offers the option to use a Gaussian curve, a block shape or a triangle. The user must specify the base discharge (this can be left at the default value, which is the average discharge), a peak discharge, a duration, and a peak time. The duration refers to the duration that the river discharge is above its base value. For a block shape, the ‘peak time’ is referred to as a ‘Midpoint’ and is the time associated with the halfway point of the discharge block.