import geopandas as gpd
import rasterio
import rasterio.plot
import contextily as cx
from datetime import datetime
from pathlib import Path
from IPython.display import HTML
from flood_adapt.objects.forcing import (
ForcingType,
WindConstant,
RainfallConstant,
WaterlevelSynthetic,
DischargeConstant,
TimeseriesFactory,
ShapeType,
SurgeModel,
TideModel,
)
from flood_adapt.objects import (
Elevate,
FloodWall,
TimeFrame,
Projection,
PhysicalProjection,
SocioEconomicChange,
Scenario,
Strategy,
SyntheticEvent,
SelectionType
)
from flood_adapt.config.sfincs import RiverModel
from flood_adapt import FloodAdapt, Settings
from flood_adapt import unit_system as us📘 Example: Simple Scenario
In this notebook we demonstrate the workflow on how you can build a simple FloodAdapt scenario in Charleston, USA, using the API.
In this notebook we will cover the following steps:
- Create a synthetic event
- Create a projection - Sea level rise (SLR)
- Create a measure and strategy - Seawall
- Create and run a scenario
- Investigate the output
Import libraries
🚀 Step 1. Reading-in the FloodAdapt database
Let’s start with initiating the database and FloodAdapt class. 1. Initiate the database class Settings by defining the DATABASE_ROOT and DATABASE_NAME. 2. Initiate the FloodAdapt class by parsing the Settings().database_path.
# Define paths
STATIC_DATA_DIR = Path("../../_data/examples/static-data/3_Measures").resolve()
SFINCS_BIN_PATH = Path("../../_data/system/win-64/sfincs/sfincs.exe").resolve()
FIAT_BIN_PATH = Path("../../_data/system/win-64/fiat/fiat.exe").resolve()
# Configure the settings
settings = Settings(
DATABASE_ROOT=Path("../../_data/examples").resolve(),
DATABASE_NAME="charleston_test",
VALIDATE_BINARIES=True,
FIAT_BIN_PATH=FIAT_BIN_PATH,
SFINCS_BIN_PATH=SFINCS_BIN_PATH,
)
# Create the FloodAdapt instance
fa = FloodAdapt(settings.database_path)🌊 Step 2. Events - Create a synthetic Event
Events in FloodAdapt are categorized into different forcings: 1. Wind 2. Rainfall 3. Discharge 4. Water Level
If you want to learn more about the individual forcings in FloodAdapt, please go and read the section on Events in the FloodAdapt documentation.
When creating an event, we need to create an Event object. Depending on which type of event we create, we select a different class. In this example we create a synthetic event, therefore we use the SyntheticEvent class.
To create the SyntheticEvent object we use the time attribute to define the event duration. This should be parsed as a TimeFrame object. In the forcings attribute we aggregated the different forcing objects in a dictionary.
In this event example we will create an event with the following forcings:
🌬️ WindConstant: Define a value for a constant wind speed (mps) and direction (degrees)
🌧️ RainfallConstant: Define a value for a constant rainfall (mm/hr)
💦 DischargeConstant: Define the x and y coordinates of the discharge point of the Cooper River and a value for a constant mean discharge (cfs) in the River- and Discharge model (same value)
🌊 WaterlevelSynthetic SurgeModel: Define a peak time (h), peak value in (m) and duration (d)
↔︎️ WaterlevelSynthetic TideModel: Define the harmonic amplitude (m), harmonic period (h) and harmonic phase (h)
For a complete guide on all the possible event options and inputs check out the notebook specifically on events.
# Create a synthetic event object
event = SyntheticEvent(
name="synthetic_nearshore",
description = "This is a synthetic nearshore event",
time=TimeFrame(
start_time=datetime(2020, 1, 1),
end_time=datetime(2020, 1, 2),
),
forcings={
ForcingType.WIND: [
WindConstant(
speed=us.UnitfulVelocity(value=5, units=us.UnitTypesVelocity.mps),
direction=us.UnitfulDirection(
value=60, units=us.UnitTypesDirection.degrees
),
)
],
ForcingType.RAINFALL: [
RainfallConstant(
intensity=us.UnitfulIntensity(
value=20, units=us.UnitTypesIntensity.mm_hr
)
)
],
ForcingType.DISCHARGE: [
DischargeConstant(
river=RiverModel(
name="cooper",
description="Cooper River",
x_coordinate=595546.3,
y_coordinate=3675590.6,
mean_discharge=us.UnitfulDischarge(
value=5000, units=us.UnitTypesDischarge.cfs
),
),
discharge=us.UnitfulDischarge(
value=5000, units=us.UnitTypesDischarge.cfs
),
)
],
ForcingType.WATERLEVEL: [
WaterlevelSynthetic(
surge=SurgeModel(
timeseries=TimeseriesFactory.from_args(
shape_type=ShapeType.triangle,
duration=us.UnitfulTime(
value=1, units=us.UnitTypesTime.days
),
peak_time=us.UnitfulTime(
value=8, units=us.UnitTypesTime.hours
),
peak_value=us.UnitfulLength(
value=1, units=us.UnitTypesLength.meters
),
)
),
tide=TideModel(
harmonic_amplitude=us.UnitfulLength(
value=1, units=us.UnitTypesLength.meters
),
harmonic_period=us.UnitfulTime(
value=12.4, units=us.UnitTypesTime.hours
),
harmonic_phase=us.UnitfulTime(
value=0, units=us.UnitTypesTime.hours
),
),
)
],
},
)💾 Step 2.1. Saving the event to the database
# Save the event to the database
fa.save_event(event)📈 Step 3. Projections - Create a projection
Projections in FloodAdapt allow us to adjust our model to future conditions such as sea level rise or/and population growth. If you want to learn more about projections in FlooAdapt, please go to the section Projections in the FloodAdapt documentation.
The projections can be divided into two categories: 1. 🌊 Physical Projections: Sea level rise, intensified precipitation, increased storm frequency 2. 💰 Socio economic change: Population growth (existing built area, new development area), economic growth
When creating a projection we need to create a Projection object. The PhysicalProjection attribute is parsed as a PhysicalProjection object which captures the physical projection such as sea lvel rise. The SocioEconomicChange attribute is parsed as a SocioEconomicChange object which captures the socioeconomic projection such as population growth. It’s not mandatory to parse both projections. If we only want to use one of the two types of projections we can leave the other one blank ().
The attributes of the PhysicalProjection or SocioEconomicChange object define the projection. In this case we parse the attribute sea_level_rise to the PhysicalProjection object and define the value in UnitfulLength and the unit in UnitTypesLength.
To get a deeper understanding for all the possible projections and their inputs go to the notebook specifically about projections.
# Create a projection object
projection = Projection(
name="SLR_2ft",
description = "This is a 2ft SLR projection",
physical_projection=PhysicalProjection(
sea_level_rise=us.UnitfulLength(value=2, units=us.UnitTypesLength.feet),
),
socio_economic_change=SocioEconomicChange(),
)💾 Step 3.1. Saving the projection to the database
# Save the projection
fa.save_projection(projection)🧱 Step 4. Measures - Create a measure
Measures in FloodAdapt enable the user to mititgate the event impacts and investigate their efficiency on the fly.
Measures can be: 1. 💦 Hydraulic measures on the hazard level 2. 🌱 Green infrastructure measures on the hazard level 3. 🏠 Impact measures on the building level.
You can read more about measures in the section Measures in the FloodAdapt documentation.
💦 In this example we will create a hydraulic measure, a sea wall of 12ft. To create a measure we need to create a Measure object. In the attributes we define the measure type object, in this example a FloodWall object. Additionally to the other attributes, we need to parse the elevation value as UnitfulLength and the unit as UnitTypesLength of the sea wall.
# Create a measure object
floodwall = FloodWall(
name="seawall_10ft",
description="10ft Seawall",
selection_type=SelectionType.polyline,
polygon_file=str(Path(STATIC_DATA_DIR / "seawall.geojson")),
elevation=us.UnitfulLength(value=10, units=us.UnitTypesLength.feet)
)🏠 Let’s add another measure on the impact level. We can elevate buildings in a specific area to mititgate the impact on these assets.
When elevating buildings as measure we need to create a Elevate object. we can also specify which building types we wan the measure to be applied to by defining the property type attribute. e can parse the building type (residential, commercial…) that is used in our Delft-FIAT Model. In this example we want to elevate all buildings so we parse ALL.
To define the elevation we need to parse a UnitfulLengthRefValue object which consists of a value of type float, a unit which can be one of the UnitTypesLength and a vertical reference from which point the elevation should be calculated. This sholud be parsed as VerticalReference object.
# Create a measure object
elevate = Elevate(
name="Elevated_homes_3ft",
description="Elevate residential buildings",
selection_type=SelectionType.polygon,
polygon_file=str(Path(STATIC_DATA_DIR / "raise_property_polygon.geojson")),
property_type="ALL",
elevation=us.UnitfulLengthRefValue(value=3, units=us.UnitTypesLength.feet, type=us.VerticalReference.floodmap)
)💾 Step 4.1. Saving the measure to the database
# Save the measure
fa.save_measure(floodwall)
fa.save_measure(elevate)🧩 Step 5. Strategies - Create a strategy
Strategies are combinations measures. They allow us to run an test multiple measures in a single model run.
To create a strategy we need to create a Strategy object. In the measures attribute we parse a list of all the names of the measures that we want to apply in that strategy.
# Create a strategy object
strategy = Strategy(
name="seawall_and_elev_build",
description="Strategy with a seawall and elevation of buildings",
measures=[floodwall.name, elevate.name],
)💾 Step 5.1. Saving the strategy to the database
# Save the strategy
fa.save_strategy(strategy)🗺️ Step 6. Create a scenario
We reached the final step where we can put all the building blocks together to create a complete scenario!
A scenario is composed of:
1. Event
2. Projection
3. Strategy (Measures)
If you want to read more about the composition of scenarios, go read the Scenario-section of the FloodAdapt documentation.
When creating a scenario we need to create a Scenario object in which we parse the name of the event, projection and strategy as attributes.
# Create a scenario object
scenario = Scenario(
name="slr_nearshore_seawall_elev_build",
description="Nearshore event with SLR projection and seawall + elevated buildings strategy",
event=event.name,
projection=projection.name,
strategy=strategy.name,
)💾 Step 6.1. Saving the scenario to the database
# Save the scenario
fa.save_scenario(scenario)🏃♀️ Final step: Run a scenario
We are ready to run the scenario! Simply parse the scenario.name into the function run_scenario.
# Run the scenario
fa.run_scenario(scenario.name)2025-06-12 04:59:09 PM - FloodAdapt.SfincsAdapter - WARNING - Failed to add event rainfall multiplier, no rainfall forcing found in the model.
2025-06-12 04:59:09 PM - FloodAdapt.SfincsAdapter - WARNING - Could not use height data from file due to missing `z` column or missing values therein. Using uniform height of 10.0 feet instead.Finished!
Congratulations you created and ran your first FloodAdapt scenario!
Output: 🕵️♀️ Let’s inspect the output
1. Output files
In your scenario output folder you should see the following files: - Flooding: Folder - Impacts: Folder - finished.txt: text file - Infometrics_“scenario_name”.csv: csv file of the overall infometrics - Infometrics_“scenario_name”“aggregation_layer”.csv: csv file of the aggregated areas. You have one file per aggregation level. In this example we have two files. - logfile”scenario_name”.log: The log of the scenario run - **“scenario_name”_metrics.html**: A metric file of your scenario output
The figure below presents a visual overview of all the output files that should be in your database after running the scenario
2. Floodmap - Inspect the floodmap
We can open and inspect the floodmap
# Plot Floodmap netcdf
netcdf = fa.get_max_water_level_map(scenario.name)
rasterio.plot.show(netcdf, title="Maximum water level map", cmap="Blues")
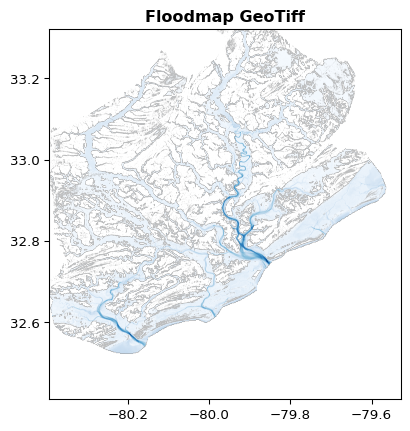
# Plot Floodmap geotiff
geotiff_map = fa.get_flood_map_geotiff(scenario.name)
geotiff = rasterio.open(geotiff_map)
rasterio.plot.show(geotiff, title="Floodmap GeoTiff", cmap="Blues")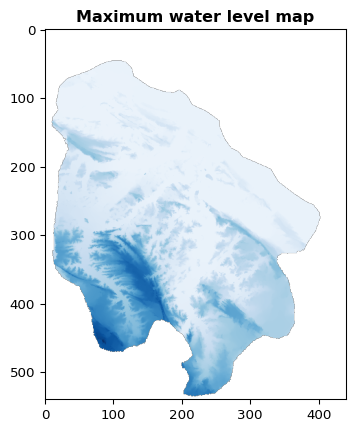
3. Economic Impacts - Inspect the economic impacts on the building level and aggregated
We can plot the economic impacts on the building level and on the aggregated level.
gdf_building_impacts = fa.get_building_footprint_impacts(scenario.name)
# Plot building impacts
ax = gdf_building_impacts.plot(
figsize=(10, 10),
column="Total Damage",
cmap="Reds",
legend=True,
vmin=0,
vmax=60000,
legend_kwds={"label": "Total Damages ($) Buildings", "orientation": "horizontal"}
)
cx.add_basemap(ax)
ax.plot()
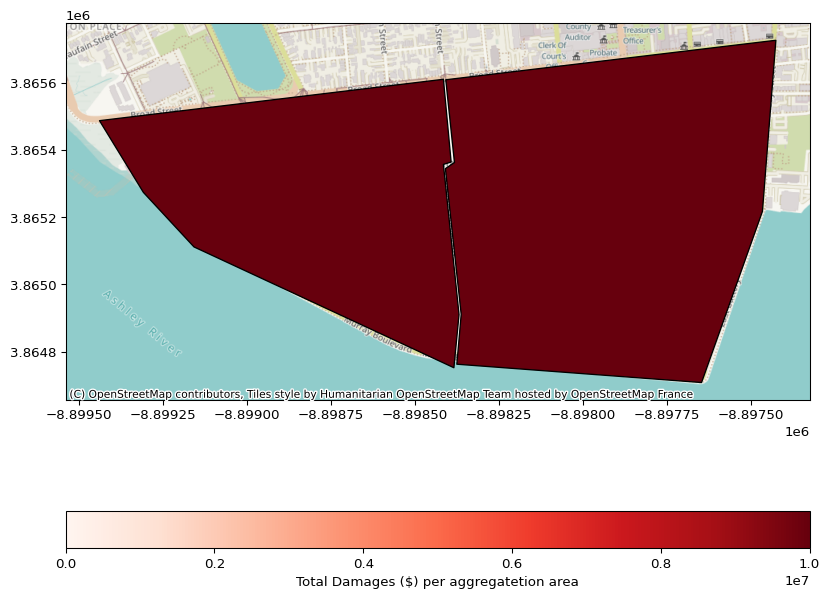
## Aggregated Impacts
gdf_impacts_aggr = fa.get_aggregated_impacts(scenario.name)
gdf_aggr_lvl1 = gdf_impacts_aggr["aggr_lvl_1"]
# # Reproject buildings crs to Web Mercator
gdf_aggr_lvl1 = gdf_aggr_lvl1.to_crs(epsg=3857)
# Plot aggregated impacts
ax = gdf_aggr_lvl1.plot(
figsize=(10, 10),
column="TotalDamageEvent",
cmap="Reds",
legend=True,
vmin=0,
vmax=10000000,
edgecolor="k",
legend_kwds={"label": "Total Damages ($) per aggregatetion area", "orientation": "horizontal"}
)
cx.add_basemap(ax)
ax.plot()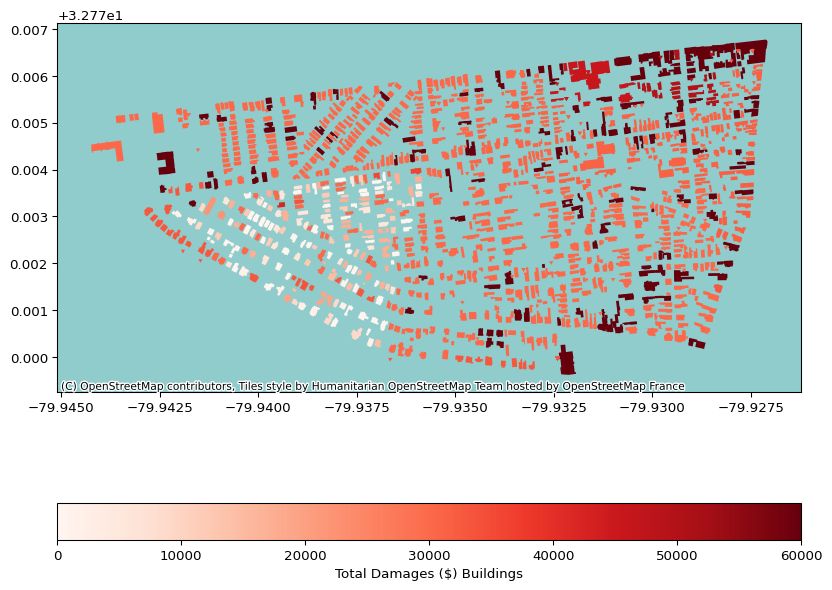
4. Infometrics & Infographics
Which infometrics and infographics to generate can be defined in the infometrics and infographics and configuration file in your database /Database/charleston_full/static/templates/infometrics/““, /Database/charleston_full/static/templates/infographics/”“.toml, respectively.
# Display HTML infographics
file = fa.get_infographic(scenario.name)
HTML(filename=file)