SFINCS model-builder
The SFINCS ModelBuilder is a user-friendly interface built on top of the HydroMT-SFINCS Python package. It simplifies the process of setting up a basic SFINCS model for an area using local data, without requiring programming expertise.
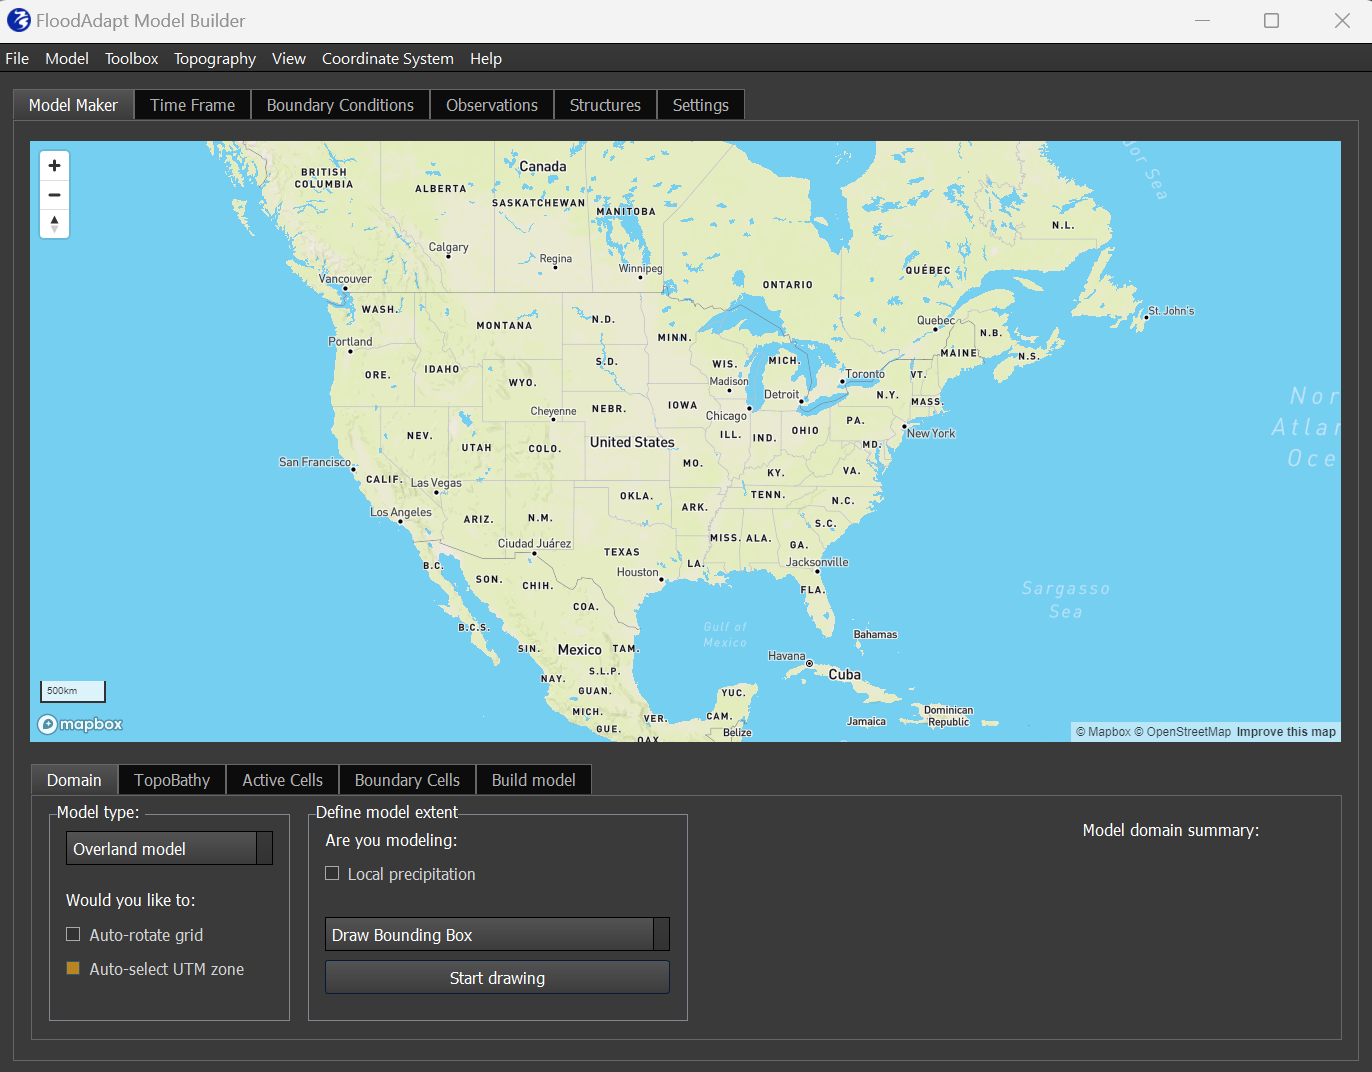
Figure 1 shows the SFINCS ModelBuilder interface, which includes six tabs in the upper section. For generating a SFINCS model compatible with FloodAdapt, you will primarily use the first tab, the ‘Model Maker’ tab. The other tabs are designed for creating standalone SFINCS models for use outside of FloodAdapt, but can be used for customizations such as editing automatically defined boundary points or setting river discharge points. Within the ‘Model Maker’ tab, the five sub-tabs at the bottom guide you through the process of creating a SFINCS model.
This guide is organized into the following sections:
- Getting started
- Defining your domain and model grid
- Mapping topography/bathymetry data to your model grid
- Defining active cells
- Defining boundary cells
- Build model
- Editing boundary points (Optional)
- Defining river discharge points (Optional)
Getting started
To get started building your SFINCS model:
- Open the ModelBuilder application; this contains functionality to build a SFINCS and a Delft-FIAT model
- Click “Model” in the top menu bar and choose “SFINCS (HydroMT)”
- Click “File” in the top menu bar and choose “Select Working Directory”
- Select an existing folder or create a new one where your model will be saved
Defining the model domain and grid
The SFINCS domain defines the area where the model will simulate hydrodynamics. For a fully functional FloodAdapt system, two SFINCS models are typically required:
Surge (a.k.a. “offshore”) model: Simulates storm surge over a large area, typically using a coarser grid resolution. Its primary purpose is to generate time series of water levels that serve as input for the overland model.
Overland model: Uses a finer grid resolution to simulate compound flooding on land.
The process of transferring water levels from the surge model to the overland model is known as “grid nesting”. In this guide, we focus on creating the overland model. Details on setting up a surge model will be provided in future updates.
- Select Overland Model:
- In the ‘Model Maker - Domain’ tab, start by selecting “Overland model”.
- Define the Spatial Coordinate System:
- Check “Auto-select UTM Zone” to automatically set the spatial coordinate system for your model.
- Leave the “Auto-rotate grid” option unchecked.
- Define the domain area:
- When modeling local precipitation (as in FloodAdapt scenarios), ensure full watershed area(s) are included:
- Check “Local Precipitation” and click “Select Watershed”.
- A pop-up will appear where you can select one or more watersheds for your domain.
- Once you’ve selected the watersheds, click “OK”.
- You may also choose to draw a polygon or upload a geospatial file to define the domain area. Take care to ensure that the domain covers the full extent of areas contributing water to the system. Failure to include these areas can cause water to pile up at the boundaries, which is why selecting entire watersheds is recommended.
- The GUI will prompt you to confirm a coordinate system change based on the domain area that was defined. Click “Yes” to proceed.
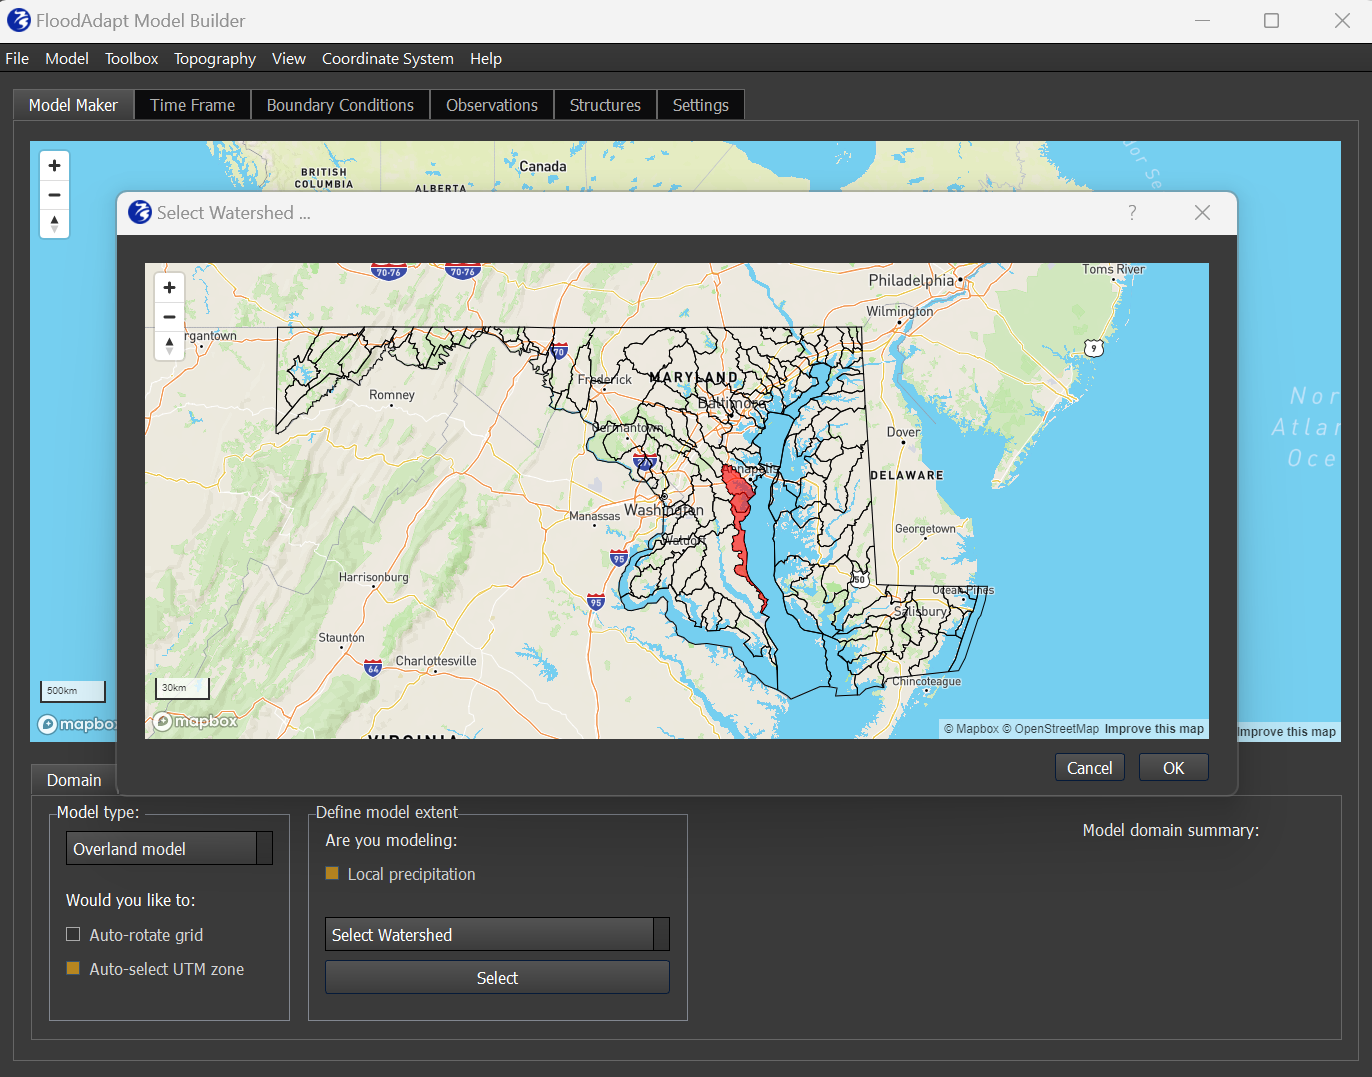
Figure 2 shows the ‘Model Maker - Domain’ tab with the “Select Watershed” pop-up.
After completing the steps above, a new box will appear for defining the model resolution.
- Define the model resolution:
- A grid resolution of 50–100 m is typically appropriate for an overland model.
- Coarser resolutions allow faster simulations but may reduce accuracy.
- It is recommended to test the model in FloodAdapt using a historical flooding event with known outcomes to ensure the chosen resolution is suitable for the location.
- Once you have chosen a resolution, click “Generate Grid”. The viewer will display a preview of the model grid.
- You can zoom in on the viewer to inspect grid details and ensure the resolution seems appropriate for features in your area.
A summary of the model domain and grid is displayed in the bottom-right corner of the GUI.
Mapping topography/bathymetry data to the grid
To map topography and bathymetry data onto your model grid, follow these steps:
- Navigate to the ‘Model Maker - TopoBathy’ Tab:
- Click on the ‘TopoBathy’ tab at the bottom of the GUI.
- Load additional DEM Dataset(s) (Optional):
- On the bottom-left of the tab, you’ll see a list of available DEM dataset sources.
- You may add a dataset by clicking “Add Dataset”. The file must be in GeoTIFF format.
- Ensure all datasets share the same vertical reference (e.g., NAVD88, MSL) to avoid inconsistencies.
- Select and Order Datasets:
- Move the desired datasets to the “Selected Datasets” box (on the right) by using the arrow button.
- If using multiple datasets, sort them in order of priority:
- The most detailed and accurate dataset should be at the top.
- Areas not covered by this dataset will be filled using subsequent datasets in the order listed.
- Generate Bathymetry:
- Once satisfied with your dataset selection and order, click “Generate Bathymetry” in the bottom-right of the GUI.
- The topography and bathymetry data will be displayed in the viewer, showing how it is mapped to the model grid.
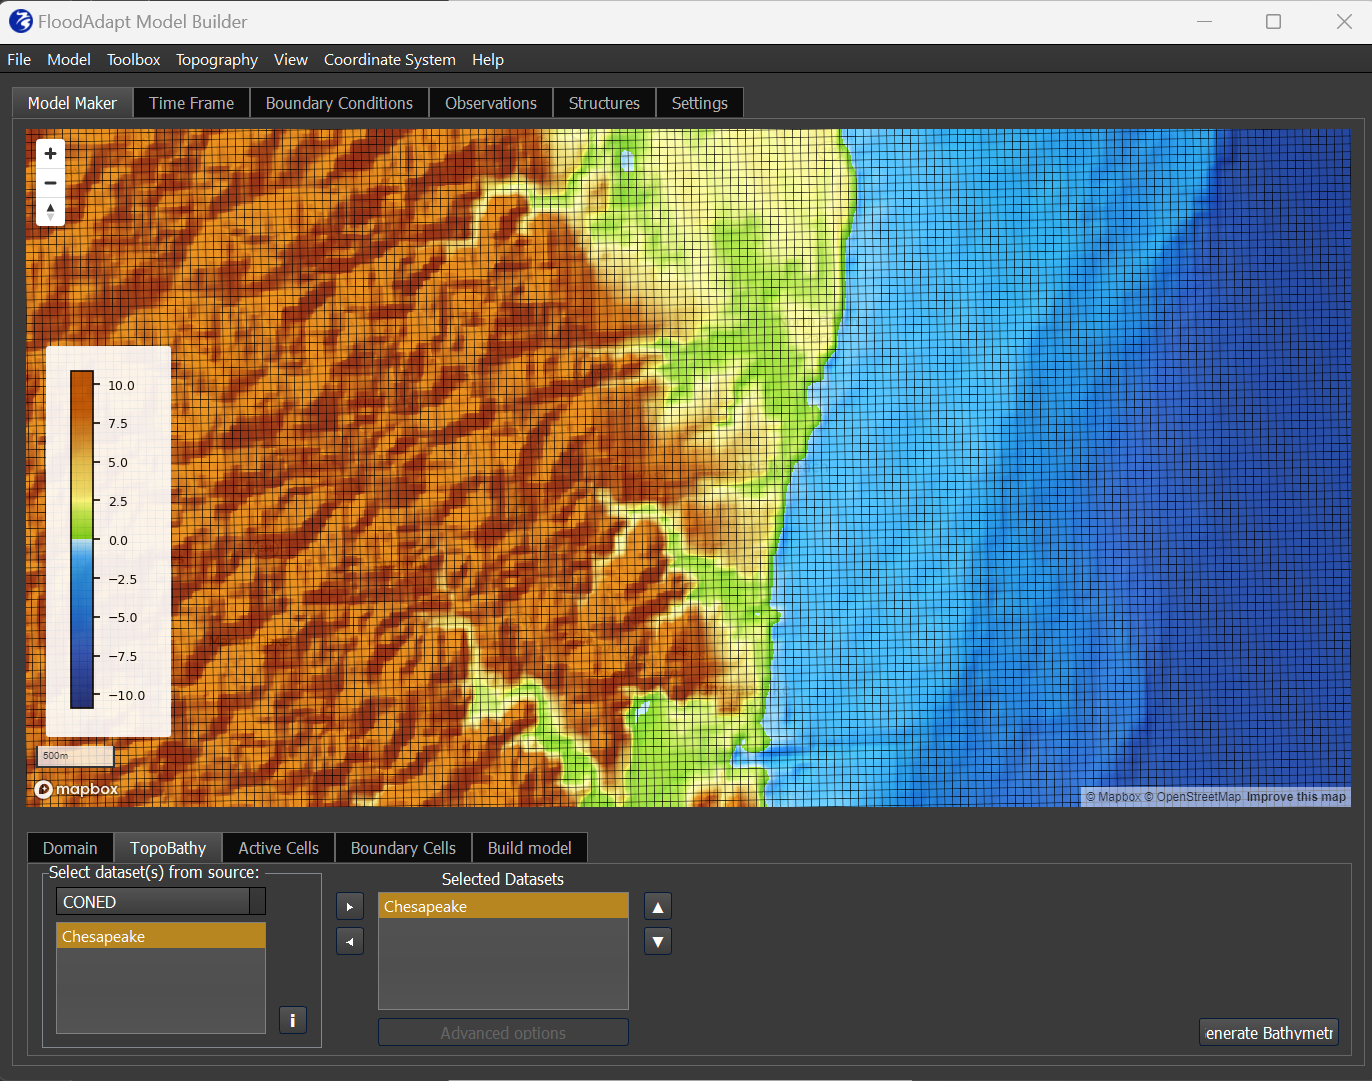
Figure 3 illustrates the ‘Model Maker - TopoBathy’ tab with a topo-bathymetric dataset mapped to the model grid.
Defining active cells
SFINCS optimizes simulations by only performing computations in “active cells” — grid cells that are within the area of interest. Cells outside this area are marked as inactive and excluded from calculations, speeding up simulations. The following steps detail how to define the active cells:
- Navigate to the ‘Model Maker - Active Cells’ tab:
- Go to the ‘Model Maker - Active Cells’ tab at the bottom of the GUI.
- Click “Show Active Cells” to display the current configuration:
- By default, cells within the selected watersheds are marked as “active”.
- Cells outside the watersheds are “inactive”.
- Modify the Active Cell Mask (Optional):
- If adjustments are needed, check the box for “Manually add/remove cells to/from your active mask.”
- You can draw or load polygons to include or exclude specific areas.
- Advanced Mask Settings (Optional):
- Click “Modify Mask Settings” to define active cells based on:
- Elevation thresholds (e.g., minimum and maximum elevation).
- Isolated areas:
- Maximum area of cells surrounded by active cells to include.
- Maximum area of isolated cells to remove.
- Re-click “Show Active Cells” to see updates.
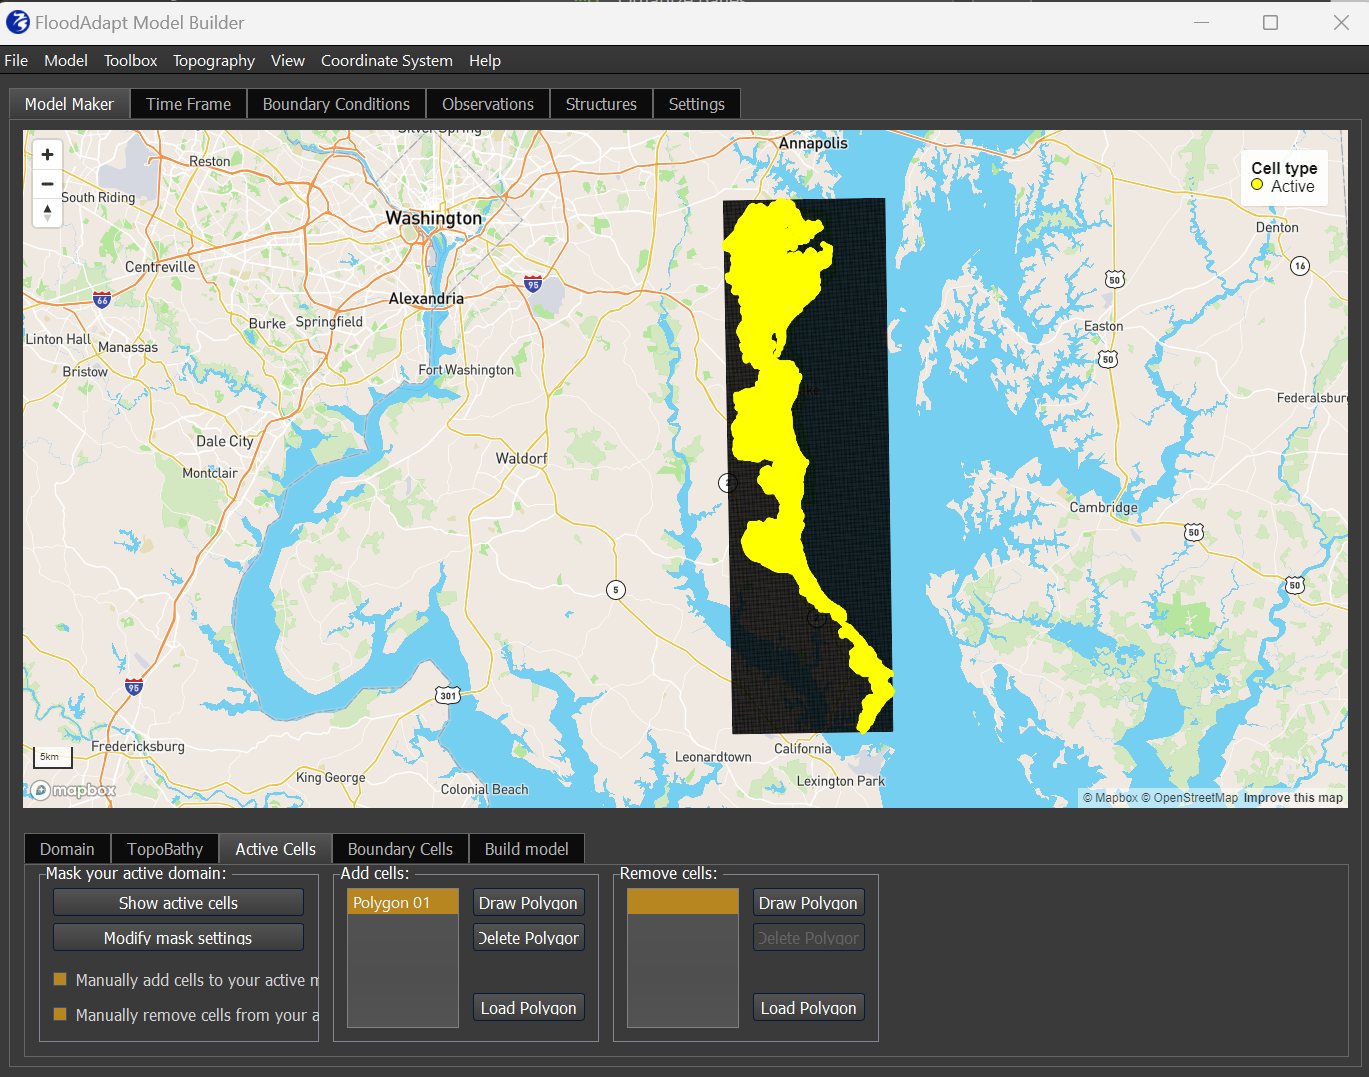
Figure 4 shows the SFINSC model-builder “Active Cells” tab, with active cells highlighted in yellow.
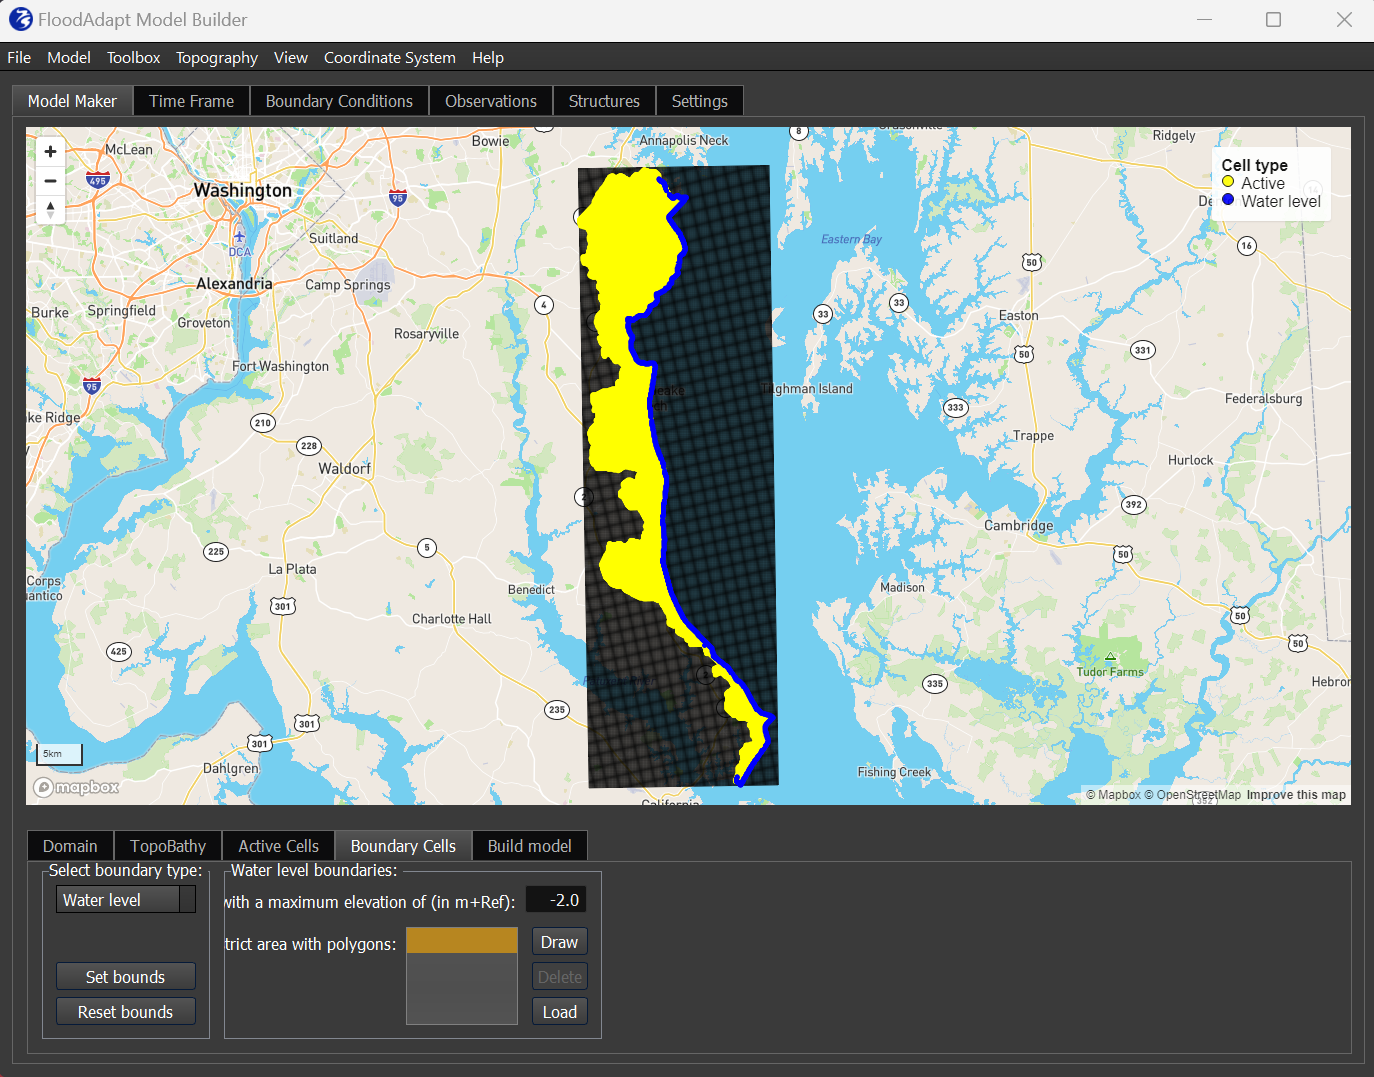
Defining boundary cells
Boundary cells are used to apply water level data to your model. These cells will be forced with data from sources such as: - An offshore model, - Synthetic tidal or surge signals, or - Historical tide gauge measurements.
To define the boundary cells, follow these steps:
- Navigate to the Boundary Cells Tab:
- Open the ‘Model Maker - Boundary Cells’ tab at the bottom of the GUI.
- Set the Water Level Boundary:
- The goal is to mark the entire offshore edge of the model as a “Water Level boundary.”
- In the GUI, these boundary cells will appear as dark blue.
- Customize the Boundary Area (Optional):
- Use polygons to restrict the boundary area if needed.
- Alternatively, use a “water depth threshold” to automatically select boundary cells.
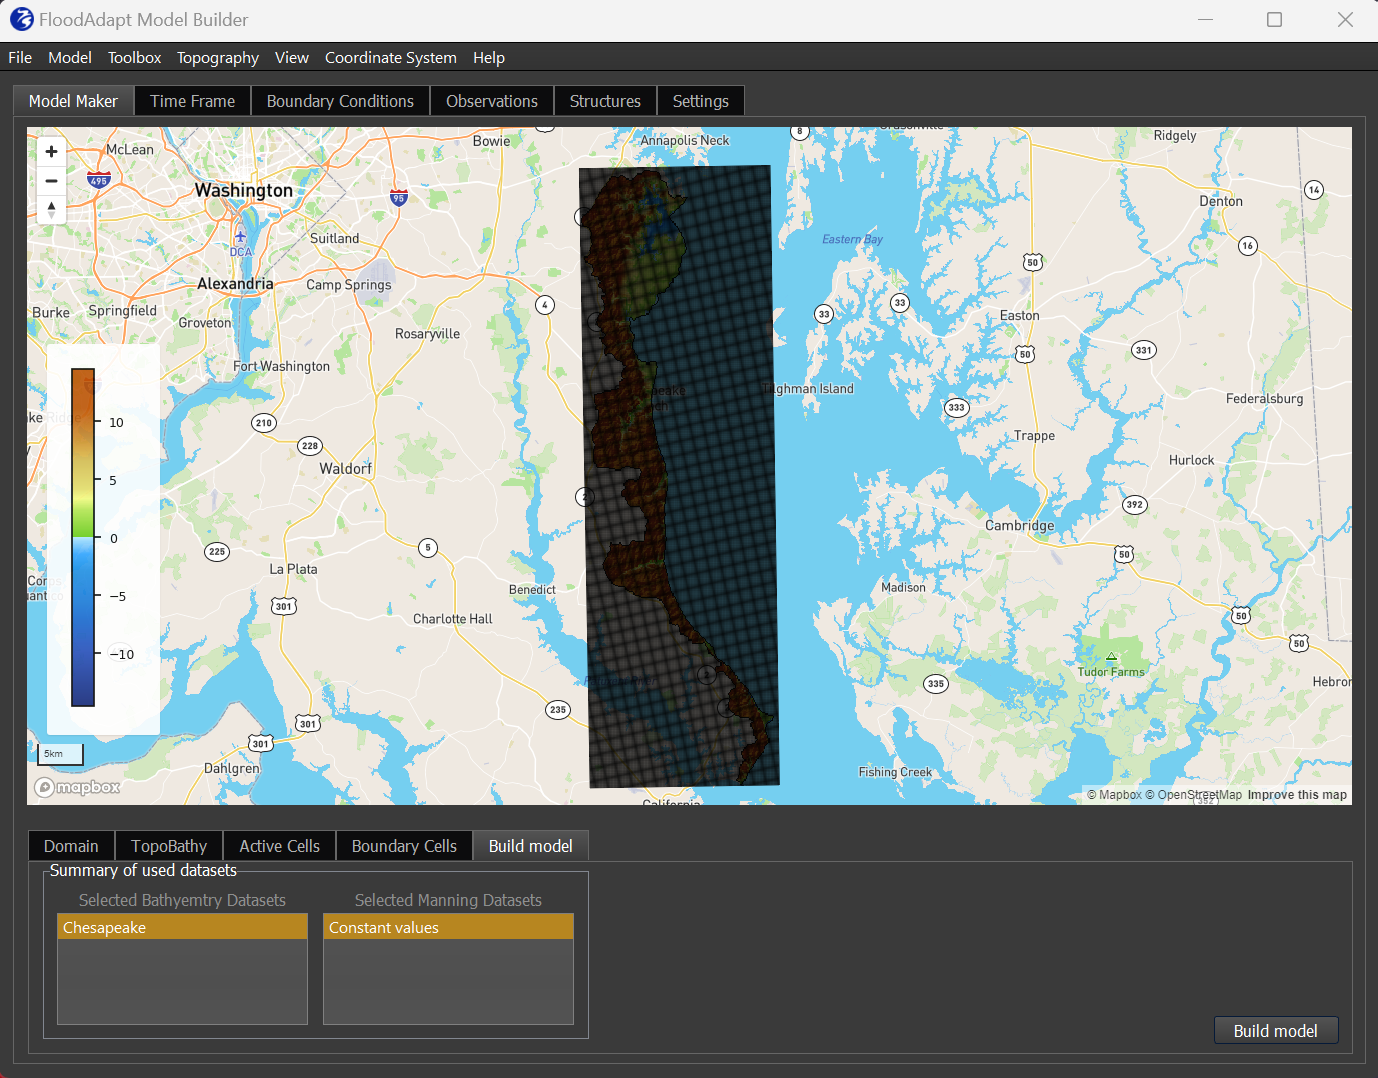
Build model
At this point, the model is ready to be built.
- Navigate to the ‘Build Model’ tab:
- Open the ‘Model Maker - Build Model’ tab at the bottom of the GUI.
- Review datasets:
- This tab gives a summary of the topo-bathymetric datasets that will be used, and bottom friction datasets.
- Currently the only bottom friction option is the default “Constant values”.
- Build the model:
- In the bottom right of the GUI, select “Build Model”.
- A pop-up will appear that says “Generating subgrid…”
- During this time, the ModelBuilder is generating the SFINCS subgrid files and saving them to the working directory chosen earlier.
- Next, you will be prompted, “Do you want to make a FloodAdapt model?” - choose “Yes”.
- This step configures the SFINCS model in such a way that FloodAdapt will be able to interact with it.
- Next, you will be asked “Specify maximum zoom level(0-20) for tiles:”
- A good default value for this is ~13.
- This enables smooth zooming capabilities within the FloodAdapt viewer.
- After selecting “OK”, the ModelBuilder will inform that it is writing the tiles.
- Define boundary points:
- The last prompt when building the model is “Do you want to automatically generate water level boundary points?”. Select “Yes” here.
- Once generated, the boundary points will appear in the GUI as dark blue dots.
- If your overland model will be nested within a larger offshore SFINCS model, the two are coupled together via these boundary points.
- See Editing boundary points for details on editing boundary points.
This completes the process of setting up a SFINCS model for FloodAdapt.
Editing boundary points (Optional)
In order to modify the automatically generated boundary points, visit the ‘Boundary Conditions - Water levels’ tab (Boundary Conditions is an upper level tab).
- Navigate to the ‘Water levels’ tab:
- Open the ‘Boundary Conditions’ upper tab, and select the ‘Water levels’ lower tab.
- Modifying Boundary Points:
- You can manually add or delete boundary points in this tab.
- Highlighting a point in the bottom right box will highlight the point in the viewer.
- Water level boundary points should be evenly spaced along the water level boundary.
- Saving Changes:
- After changes are made, select “File” then “Save”.
Defining river discharge points (Optional)
In order to define a river discharge point, visit the ‘Boundary Conditions - Discharge’ tab (Boundary Conditions is an upper level tab).
- Navigate to the ‘Discharge’ tab:
- Open the ‘Boundary Conditions’ upper tab, and select the ‘Discharge’ lower tab.
- Define the river discharge point location:
- You can manually add or delete river discharge points in this tab.
- Once a point is added, you can add a default discharge value in cubic meters per second.
- Discharge points act as a source point in the model, water enters the domain at that location at the rate specified.
- Saving Changes:
- After changes are made, select “File” then “Save”.