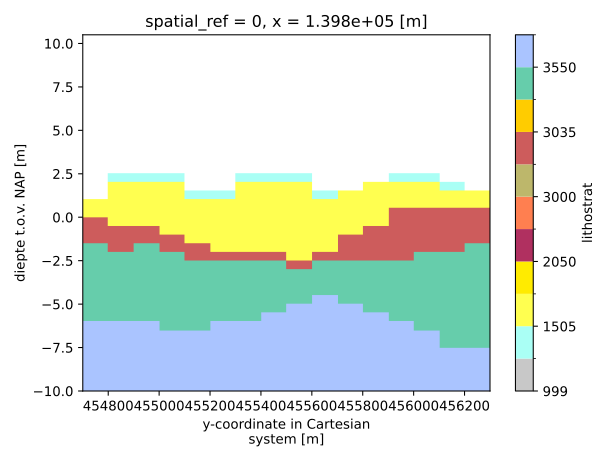
geost.bro.geotop.GeotopUnits.get_plot_colormap#
- GeotopUnits.get_plot_colormap() dict[ListedColormap, BoundaryNorm][source]#
Get a dictionary with a plot colormap and value boundaries for use in matplotlib figures. The resulting dictionary contains a ListedColormap object, derived from the RGB codes and a BoundaryNorm object which determines the value boundaries for which color to use.
- Returns:
Dictionary containing the colormap (cmap) and the normalization (norm) for plotting.
- Return type:
dict[ListedColormap, BoundaryNorm]
Example
For example when a 2D section of the GeoTOP stratigraphy, first load the model data and stratigraphic metadata:
>>> import geost
... geotop = geost.data.geotop_usp() # Load the GeoTOP model data
... strat = geost.bro.geotop_strat_units() # Load the stratigraphic metadata of GeoTOP
Then select the stratigraphic units that are present in the model from the metadata:
>>> strat = strat.select_voxel_nr(geotop)
Finally, select a 2D section and pass the resulting dictionary to the plotting function:
>>> section = geotop["strat"].sel(x=139850, z=slice(-10, None))
>>> section.plot.imshow(x="y", **strat.get_plot_colormap())