Benefits
Flood adaptation measures are designed to reduce flood risk, and are typically evaluated by calculating their risk-reduction benefits and the benefit-cost ratio, which compares benefits with the implementation and maintenance costs of the measure(s).
FloodAdapt supports users in evaluating the risk-reduction benefits of strategies by automating the benefit calculation and guiding the user in the creation of the scenarios needed to calculate benefits.
When you first go to the Benefits tab in FloodAdapt (see Figure 1) you will see an empty list box in the lower panel. Once you create benefit analyses these will appear in the list. To the right of the list box there are buttons to add, edit, or delete a benefit analysis. Before creating your first benefit analysis, only the ‘Add benefit analysis’ button is active.
The following sections will describe how to create a benefit analysis, how benefits are calculated, how to view benefit analysis output in the Benefits tab, and where you can find output on your computer for more detailed investigation.
- Creating a new benefit analysis
- Calculating benefits
- Viewing benefit output in the Benefits tab
- Benefits output folder.
To run a benefit analysis, you must have a probabilistic event set prepared for your site. This event set enables the calculation of risk, which is needed when calculating the risk-reduction benefits of adaptation strategies.
Creating a new benefit analysis
FloodAdapt users can evaluate the risk-reduction benefits of any strategy they have created (which can be composed of a single measure or a collection of measures). To do this, go to the Benefits tab in FloodAdapt, and in the bottom panel click on “Add benefit analysis”. A popup window will appear within which you will specify important choices about your benefit analysis.
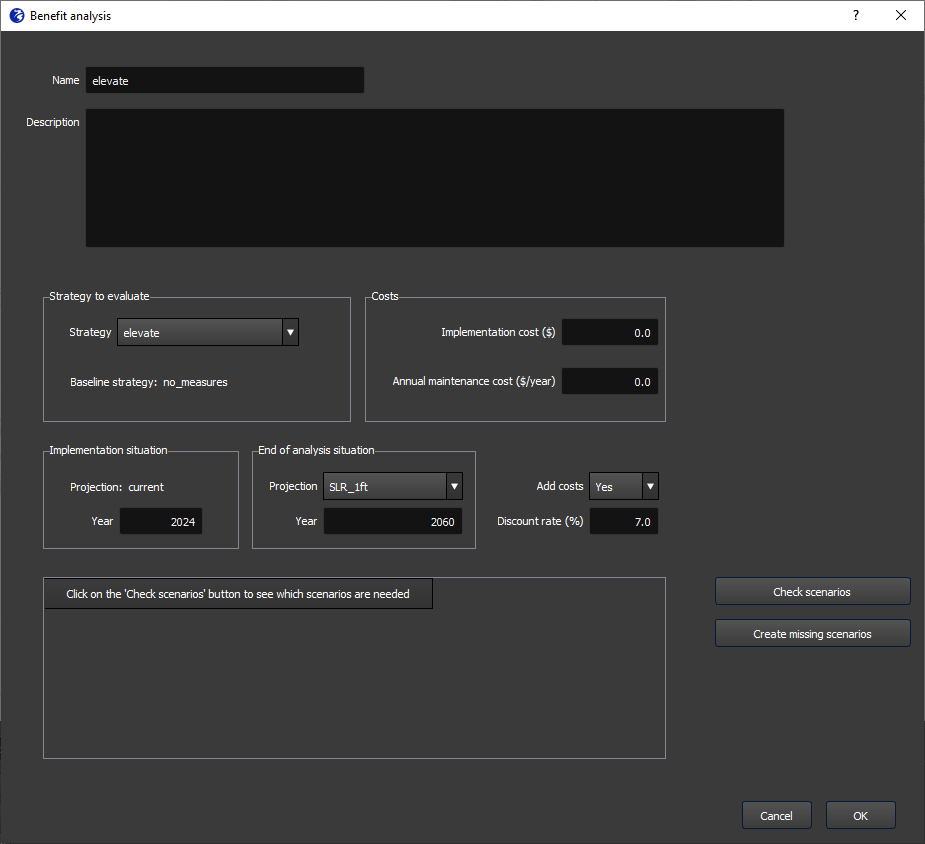
For the following description please refer to Figure 2. To create a new benefit analysis:
- Analysis name: Enter a name for your analysis. This cannot have any spaces or special characters (underscores are ok). Choose a name that will help you identify your analysis easily in the benefits tab; for example “benefits_floodwall”. You can optionally also add a description.
- Strategy to evaluate: In the “Strategy to evaluate” panel, select the strategy for which you want to calculate benefits. The baseline strategy is selected for you and consists of the ‘no-measures’ strategy.
- Situation at implementation: The implementation situation consists of the ‘current’ projection representing current climate and socio-economic conditions (pre-selected). The implementation year can be adjusted but by default is set to the ‘current’ year defined during system setup.
- Situation at end of analysis: In the end-of-analysis situation, specify the year that corresponds to the duration over which you want to calculate benefits. In Figure 2, the year 2060 is specified. That means benefits will be calculated between the current year up to and including 2060. From the “Projection” dropdown menu, select the climate and/or socio-economic conditions you expect at this end-of-analysis year. For example, if you expect sea level rise to be 1 foot at the year specified (e.g. 2060 in Figure 2), then choose a projection with 1 foot of SLR. Note that you must have already created such a projection in order to select it here. The projection dropdown menu will contain all projections that have been created in the Projections tab.
- Costs: If you have information on the implementation and maintenance costs of your project, you can set “Add costs” to “Yes” and a “Costs” panel will appear. Here you can enter the costs. If you do not have this information, set “Add costs” to “No” and the “Costs” panel will disappear. When cost information is not available, FloodAdapt will only calculate the risk-reduction benefits. When cost information is available, it will additionally calculate the benefit-cost ratio, net present value, and internal rate of return. These latter two are saved on your computer but not presented in the Benefits tab.
- Discount rate: Enter a discount rate. A discount rate is used in benefit-cost analysis to discount future benefits and costs. It reflects the idea that benefits and costs are worth more if they are experienced sooner. When discount rates are higher, the overall present value of benefits will be lower than when the discount rate is lower. Users are free to explore different discount rates and the effect these have on the present value of benefits and the benefit-cost ratio.
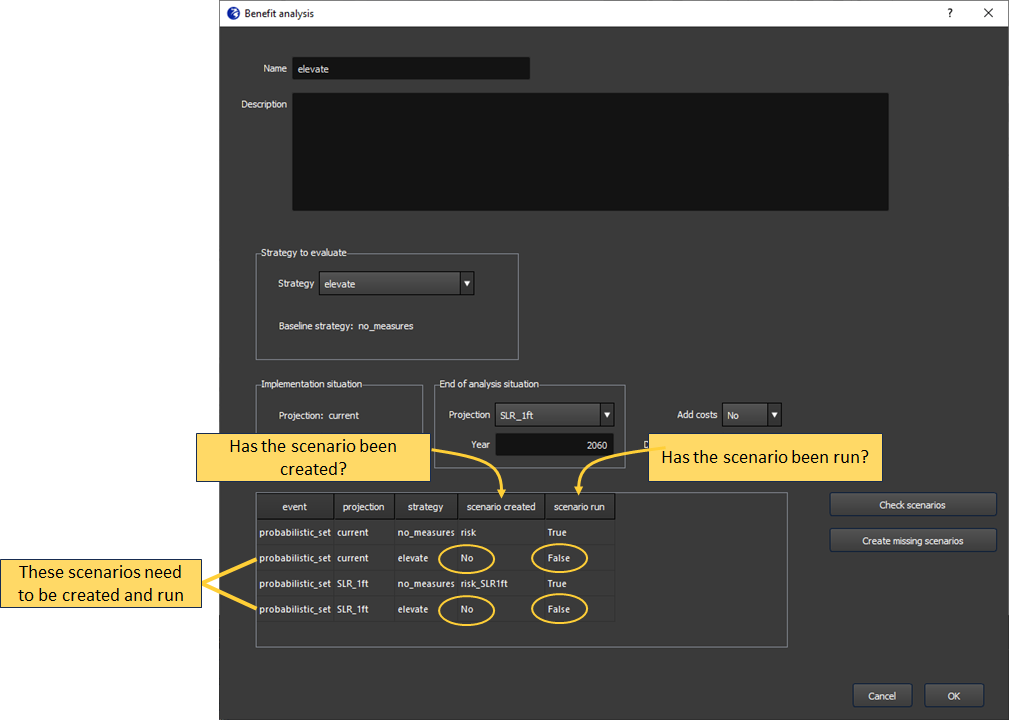
- Check scenarios: Once you have entered the above information, click the “Check scenarios” button. FloodAdapt helps you to determine which scenarios need to be run in order to carry out the benefit analysis you specified. The risk-reduction benefit analysis requires risk calculations with and without the selected strategy under current conditions and with and without the strategy under the projection selected for the end of the analysis situation. When you click “Check scenarios”, the scenarios that need to be run will be shown in the table in the popup window (see Figure 3). The column “scenario created” will list the scenario name if the scenario has already been created and will say “No” if the scenario has not been created. The column “scenario run” will indicate whether the scenario has already been run (True) or not (False).
- Create missing scenarios: If any of the required scenarios is missing when you click “Check scenarios”, you can click “Create missing scenarios” and FloodAdapt will automatically create the missing scenarios and place them in the scenarios table in the Scenarios tab.
- Click “OK” to add the analysis to the Benefits tab
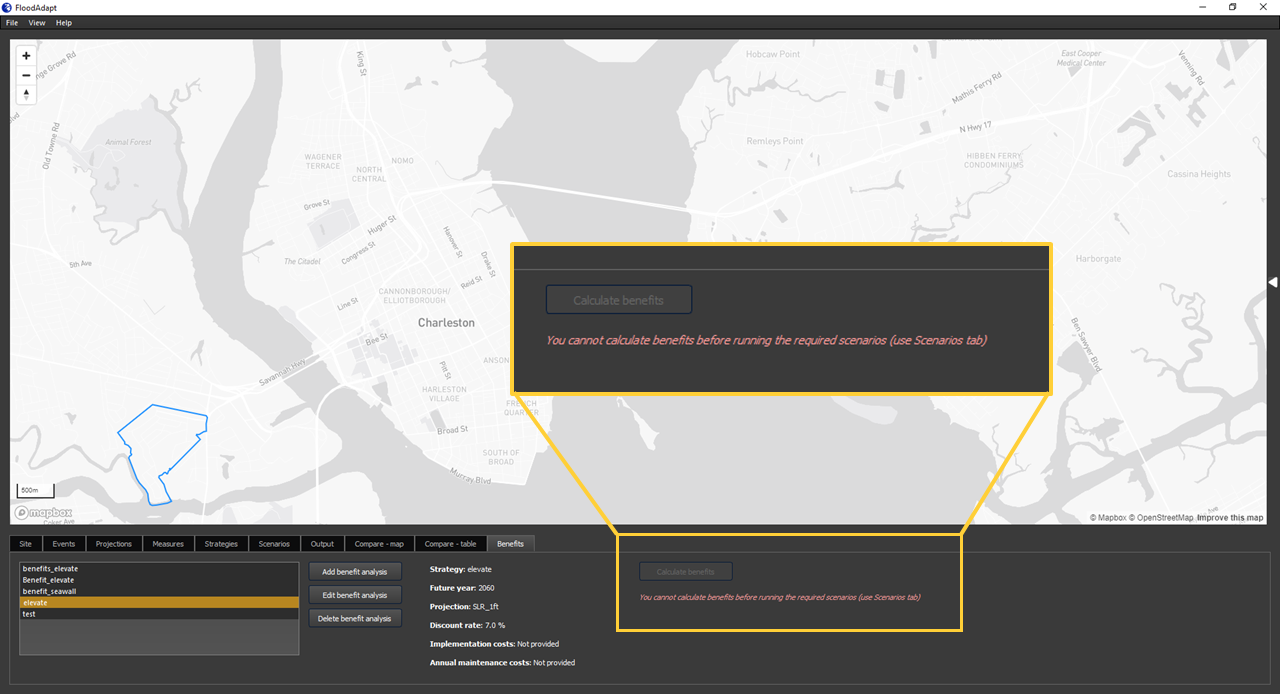
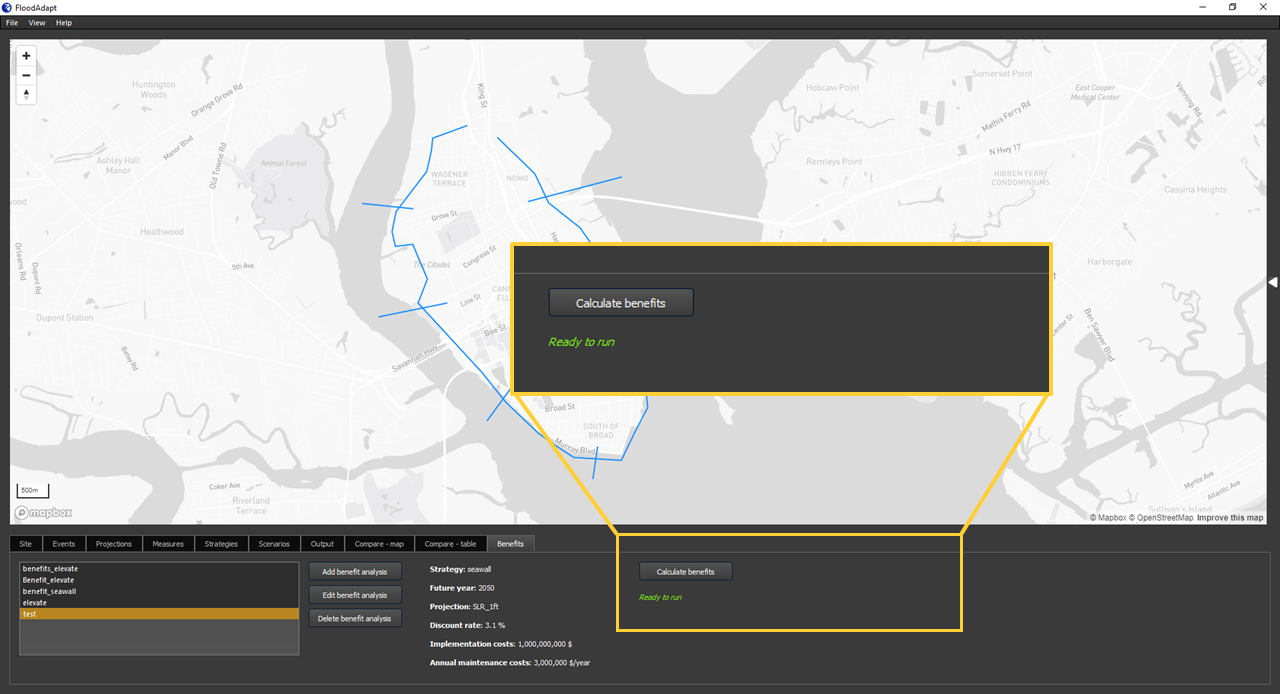
The “Check scenarios” and “Create missing scenarios” buttons guide users to ensure the required scenarios are created for the benefit analysis. However, scenarios can only be run from the Scenarios tab. If any of the four required scenarios have not been run, you need to go to the Scenarios tab and run them. If any of the required scenarios have not yet been run, the “Calculate benefits” button will be greyed out and you will see text beneath it informing you that “You cannot calculate benefits before running the required scenarios (use Scenarios tab)”, see Figure 4.
Calculating benefits
Once the required scenarios have been simulated, the “Calculate benefits” button will be active, see Figure 5. When the button is clicked, the benefit calculation happens on-the-fly, but because the risk information is already calculated, the benefit calculation happens very quickly and the results appear instantly.
The benefit calculation uses output from four scenarios:
- The risk without the strategy implemented in current conditions
- The risk with the strategy implemented in current conditions
- The risk without the strategy implemented in future conditions
- The risk with the strategy implemented in future conditions
When the “Calculate benefits” button is clicked, the following benefit calculations are carried out:
The risk-reduction benefit under current conditions is calculated as the difference in the risk without the strategy and with the strategy under the “current” projection (representing current conditions).
The risk-reduction benefit under future conditions (for the year specified in the end-of-analysis situation) is calculated as the difference in the risk without the strategy and with the strategy under the future projection specified in the end-of-analysis situation when you created your benefit analysis.
The annual risk-reduction benefits are calculated by linearly interpolating between the risk-reduction benefits under current conditions (in the current year) and the risk-reduction benefits under future conditions (in the end-of-analysis year).
The annual discounted benefits (\(B_d(t)\)) are calculated as
\(B_d\ (t)=B(t)/(1+r)^t\ \)
where \(B(t)\) is the risk-reduction benefit in year \(t\), \(t\) is the year since implementation, and \(r\) is the discount rate.
The (present value of the) benefits are calculated as the sum of the annual discounted benefits over the analysis duration (\(N\) years).
\(Benefits\ =\ \sum_{t=0}^N B_d\ (t)\ \)
When cost information is provided, FloodAdapt additionally calculates:
The (present value of the) costs - calculated only when implementation and/or maintenance costs are provided in the benefit analysis input. This is calculated in the same way as the present value of the benefits: \(Costs\ =\ \sum_{t=0}^N C_d\ (t)\ \)
where \(C_d(t)\) is the discounted cost in year \(t\).
The benefit-cost ratio (BCR) is calculated as the present value of the benefits divided by the present value of the costs.
The net present value (NPV) is the difference in annual discounted benefits and costs, summed up over the analysis period.
\(NPV\ =\ \sum_{t=0}^N [(B(t)-C(t))/(1+r)^t]\ \)
The internal rate of return (IRR) represents the discount rate at which the NPV would be equal to zero. Higher IRR indicates a better investment, because in this case the benefits weigh strongly against the costs.
The output from these calculation steps can be viewed in the Benefits output tab and can additionally be accessed on the user’s computer.
The present value of the costs, benefit cost ratio, net present value, and internal rate of return are only calculated if the user has provided information on implementation and/or maintenance costs when they created their benefit analysis. When this information is not provided, the benefits are calculated, but none of the metrics that require comparison with costs.
Viewing benefit output in the Benefits tab
Figure 6 shows the Benefits tab in FloodAdapt once a benefit analysis has been completed. The window is separated into a top panel with a map window on the left and, when using the collapsible frame, a time series of benefits on the right. When a benefit analysis is selected in the list, the measures in the strategy for which benefits are being calculated will appear in the map window. The bottom panel will show a summary of the user-provided input to the benefit analysis, such as discount rate or end-year of the analysis. Once the user clicks the “Calculate benefits” button, output will appear in the panel. This output consists of the (present value of the) benefits and a benefit-cost ratio (if cost information was provided). The collapsible frame contains a graphic with the risk-reduction benefits calculated under current conditions and under future conditions (green dots in the figure), the interpolated benefits over time (black line), the discounted benefits over time (dark green line), and the area under the discounted benefits curve (green shading) representing the present value of the benefits.
In addition to the above results which can be viewed in the Output tab, FloodAdapt also calculates - when implementation and/or maintenance cost information is provided - the net present value and the internal rate of return. These are provided in a results text file in the benefits output folder.
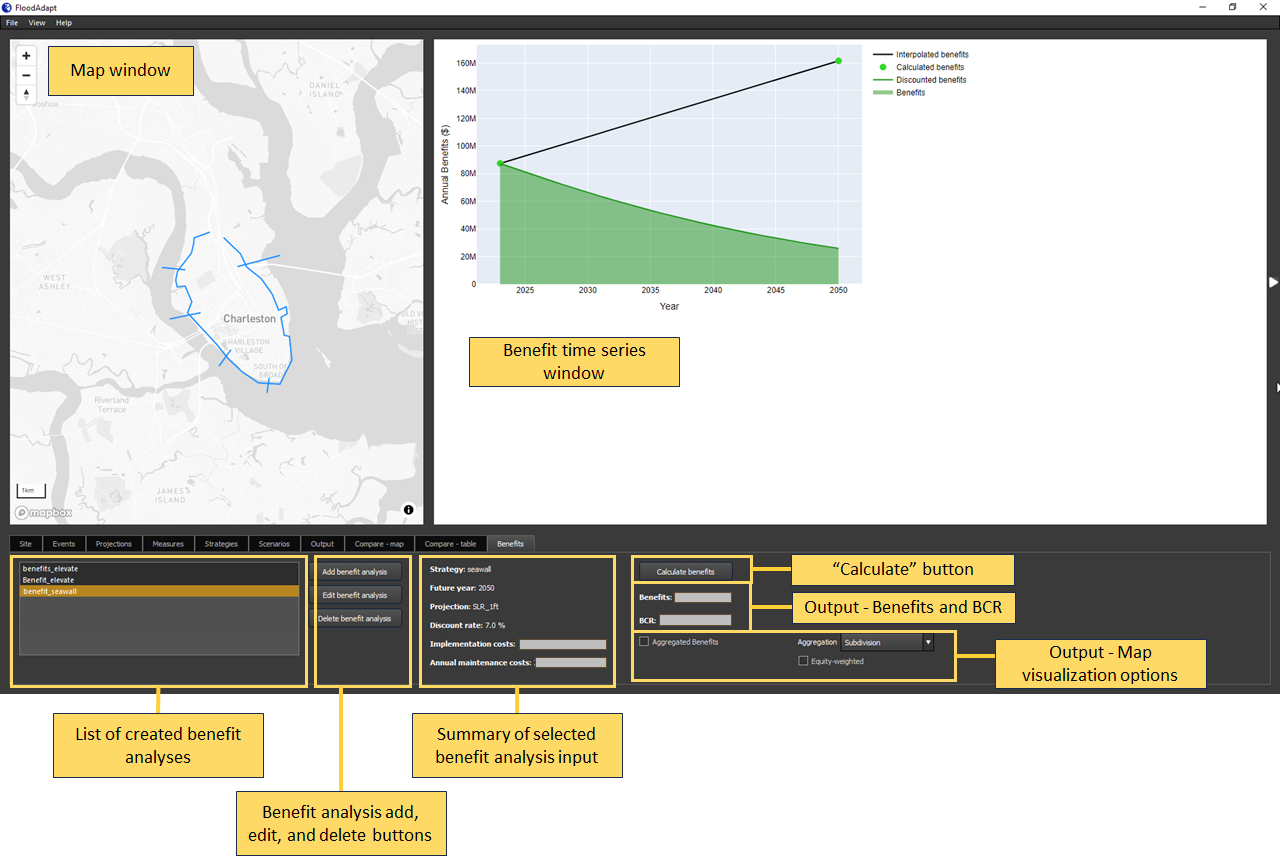
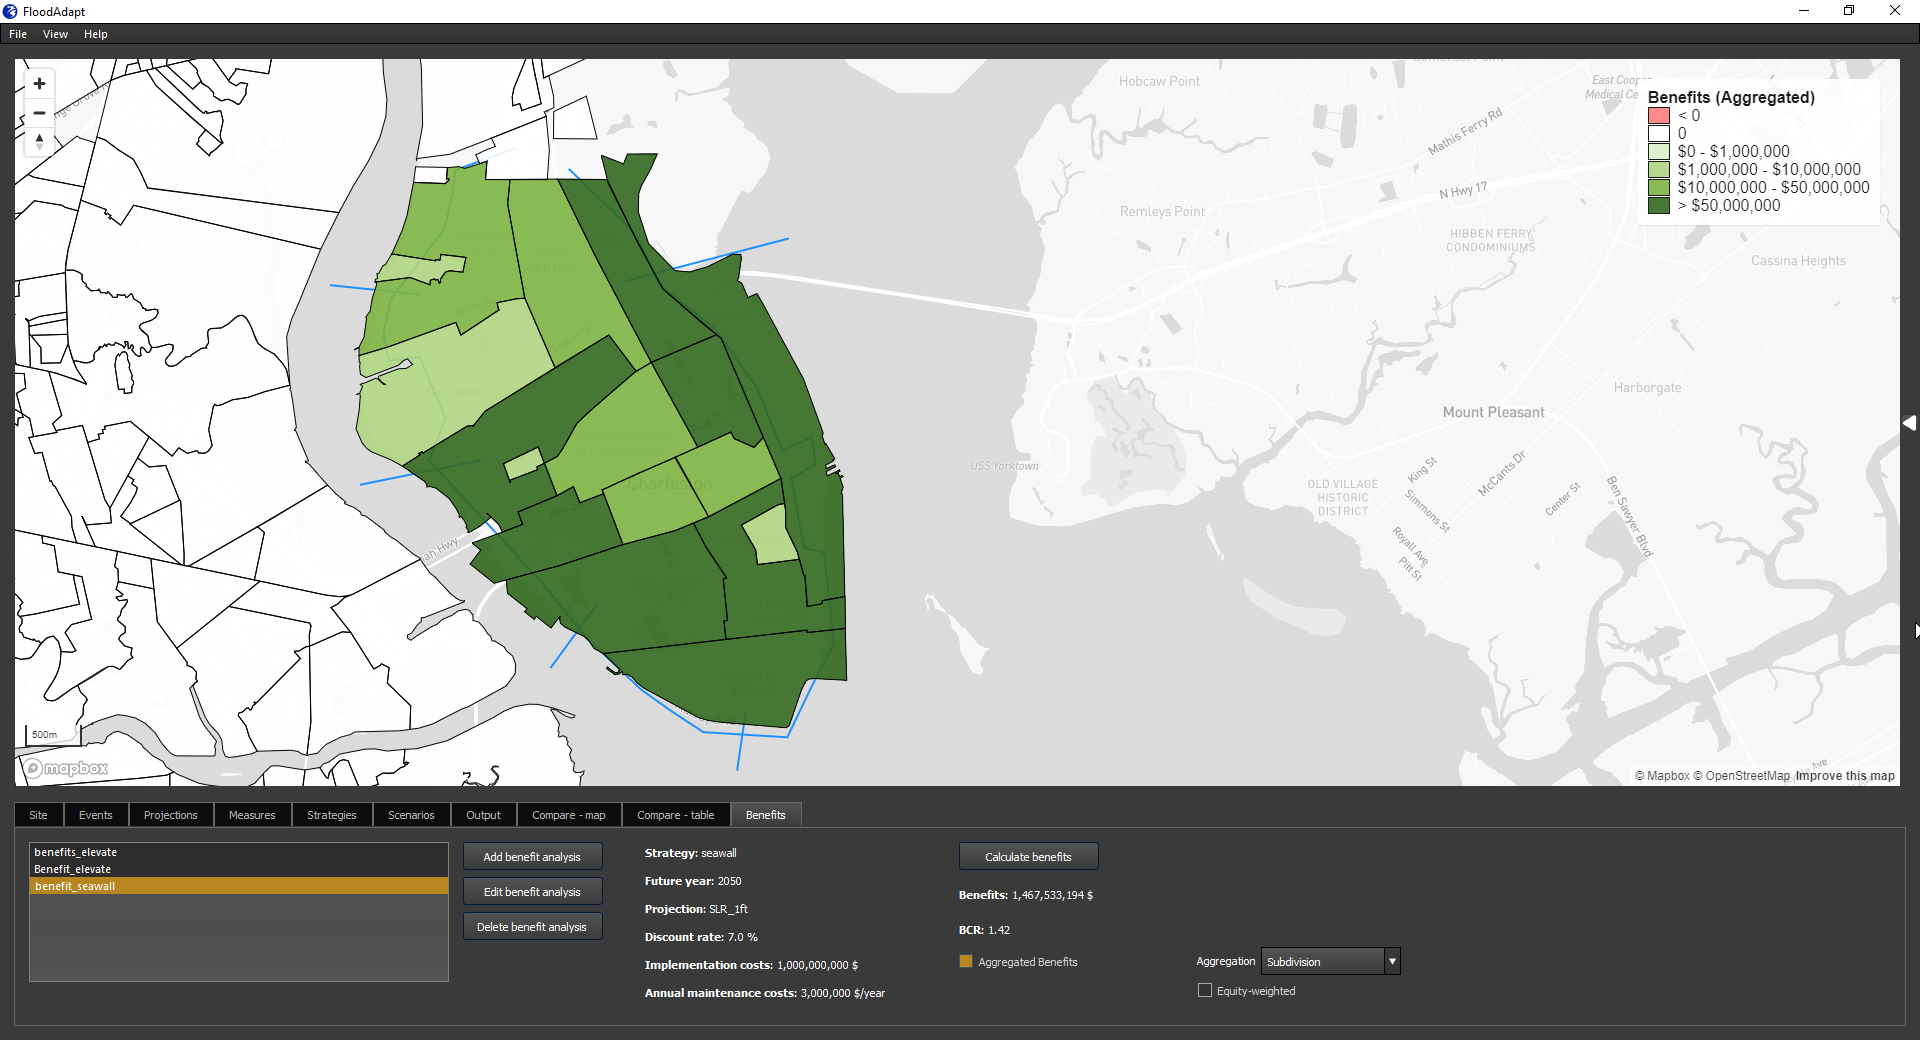
The benefits can also be viewed spatially; the lower panel contains map visualization options (see Figure 6). The user can click “Aggregated benefits” to see the spatial distribution of benefits (see Figure 7 for an example). They can choose from the “Aggregation” drop-down menu which aggregation level they would like to view, for example neighborhoods or census blocks.
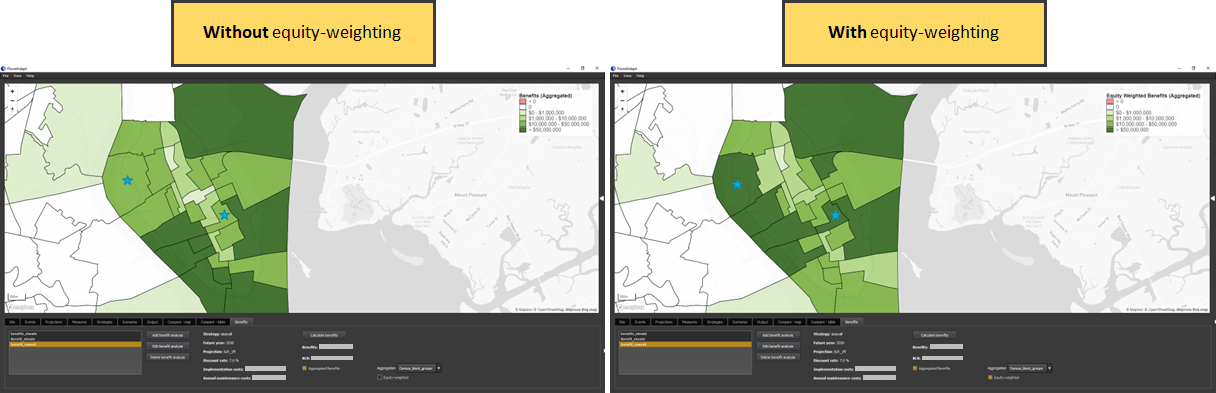
In the map visualization options, there is also an equity-weighted button. When this is checked the distributed (aggregated) benefits are displayed using equity weights, see Figure 8. The figure shows the benefits without equity weights on the left and with equity weights on the right. In the figure, blue stars have been added (outside of FloodAdapt) to highlight how the equity weighting affects lower-income census-block groups. When equity weights are applied, the benefits of these lower-income areas will be weighted more heavily; in contrast, high-income area benefits will be weighted less heavily. Equity weights are calculated in FloodAdapt using information on income. Risk estimates are multiplied by the equity weights to derive equity-weighted risk estimates, from which equity-weighted benefits are calculated. This visualization is only available at the same scale for which income data is available. This will typically be census block level.
Benefits output folder
The output from a benefit analysis is saved on a user’s computer, aspiring to provide full access and transparency. This section will describe the output files saved from the benefit analysis.
Figure 9 shows where the output folder is located within the FloodAdapt database. The database root directory could contain multiple site databases, for different locations, or even variations of databases for the same location. The output folder is located directly inside the site database folder.
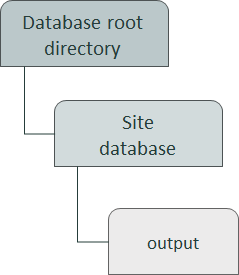
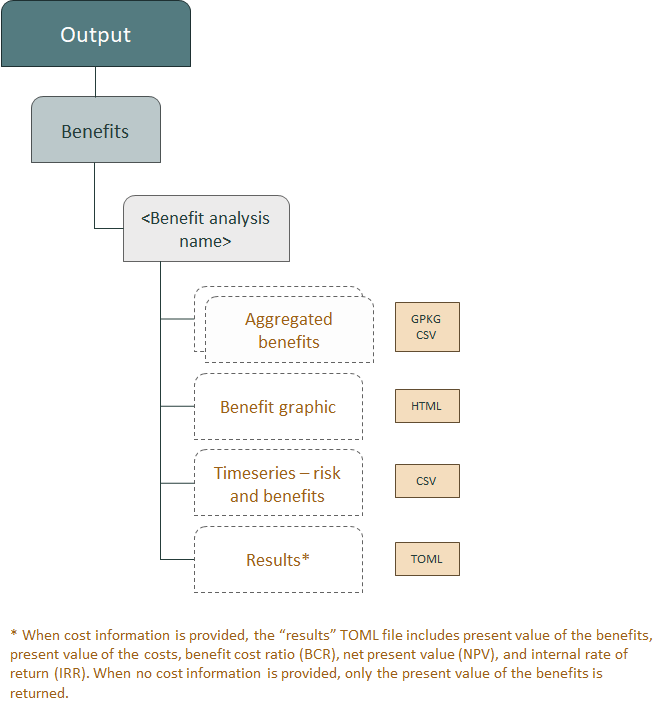
The output folder contains a subfolder named “Benefits”. Within this subfolder you will find one folder for each benefit analysis that has been run. The name of the folder will be the name of the benefit analysis. Each folder will contain several files (see Figure 10):
- Benefits graphic (HTML file) that contains the same graphic displayed in the collapsible frame in the Benefits tab.
- Benefits per aggregation area, one CSV file for each aggregation scale defined for the site (e.g. neighborhoods or census block groups). For the aggregation scale for which income data is available (usually census block group), the CSV file will contain a column on benefits and one on equity-weighted benefits.
- Spatial benefits as geopackage (GPKG) files, one file for each aggregation scale defined for the site.
- Summary results of the benefit analysis as a text file (TOML file). This file always contains the total benefits (present value). If cost information was provided when setting up the benefit analysis, this file will also contain costs (present value), net present value (NPV), the benefit cost ratio (BCR), and the internal rate of return (IRR).
- A time series of annual risk with and without the strategy implemented, annual costs and benefits (absolute and discounted), and annual profit as the difference between benefits and costs (absolute and discounted).