Socio-economic projections
This section will describe how future projections of population in existing built area, population growth in new development areas and economic growth are specified and implemented in FloodAdapt.
Population growth - existing built area
To represent population growth in existing built areas within the community, the user can choose “Population Growth - Existing” (see Figure 1). The user enters a percentage (such as 10%) which represents the percentage of the current existing population. So if there are 100,000 people now living in a community, a 10% increase would represent an additional 10,000 residents.
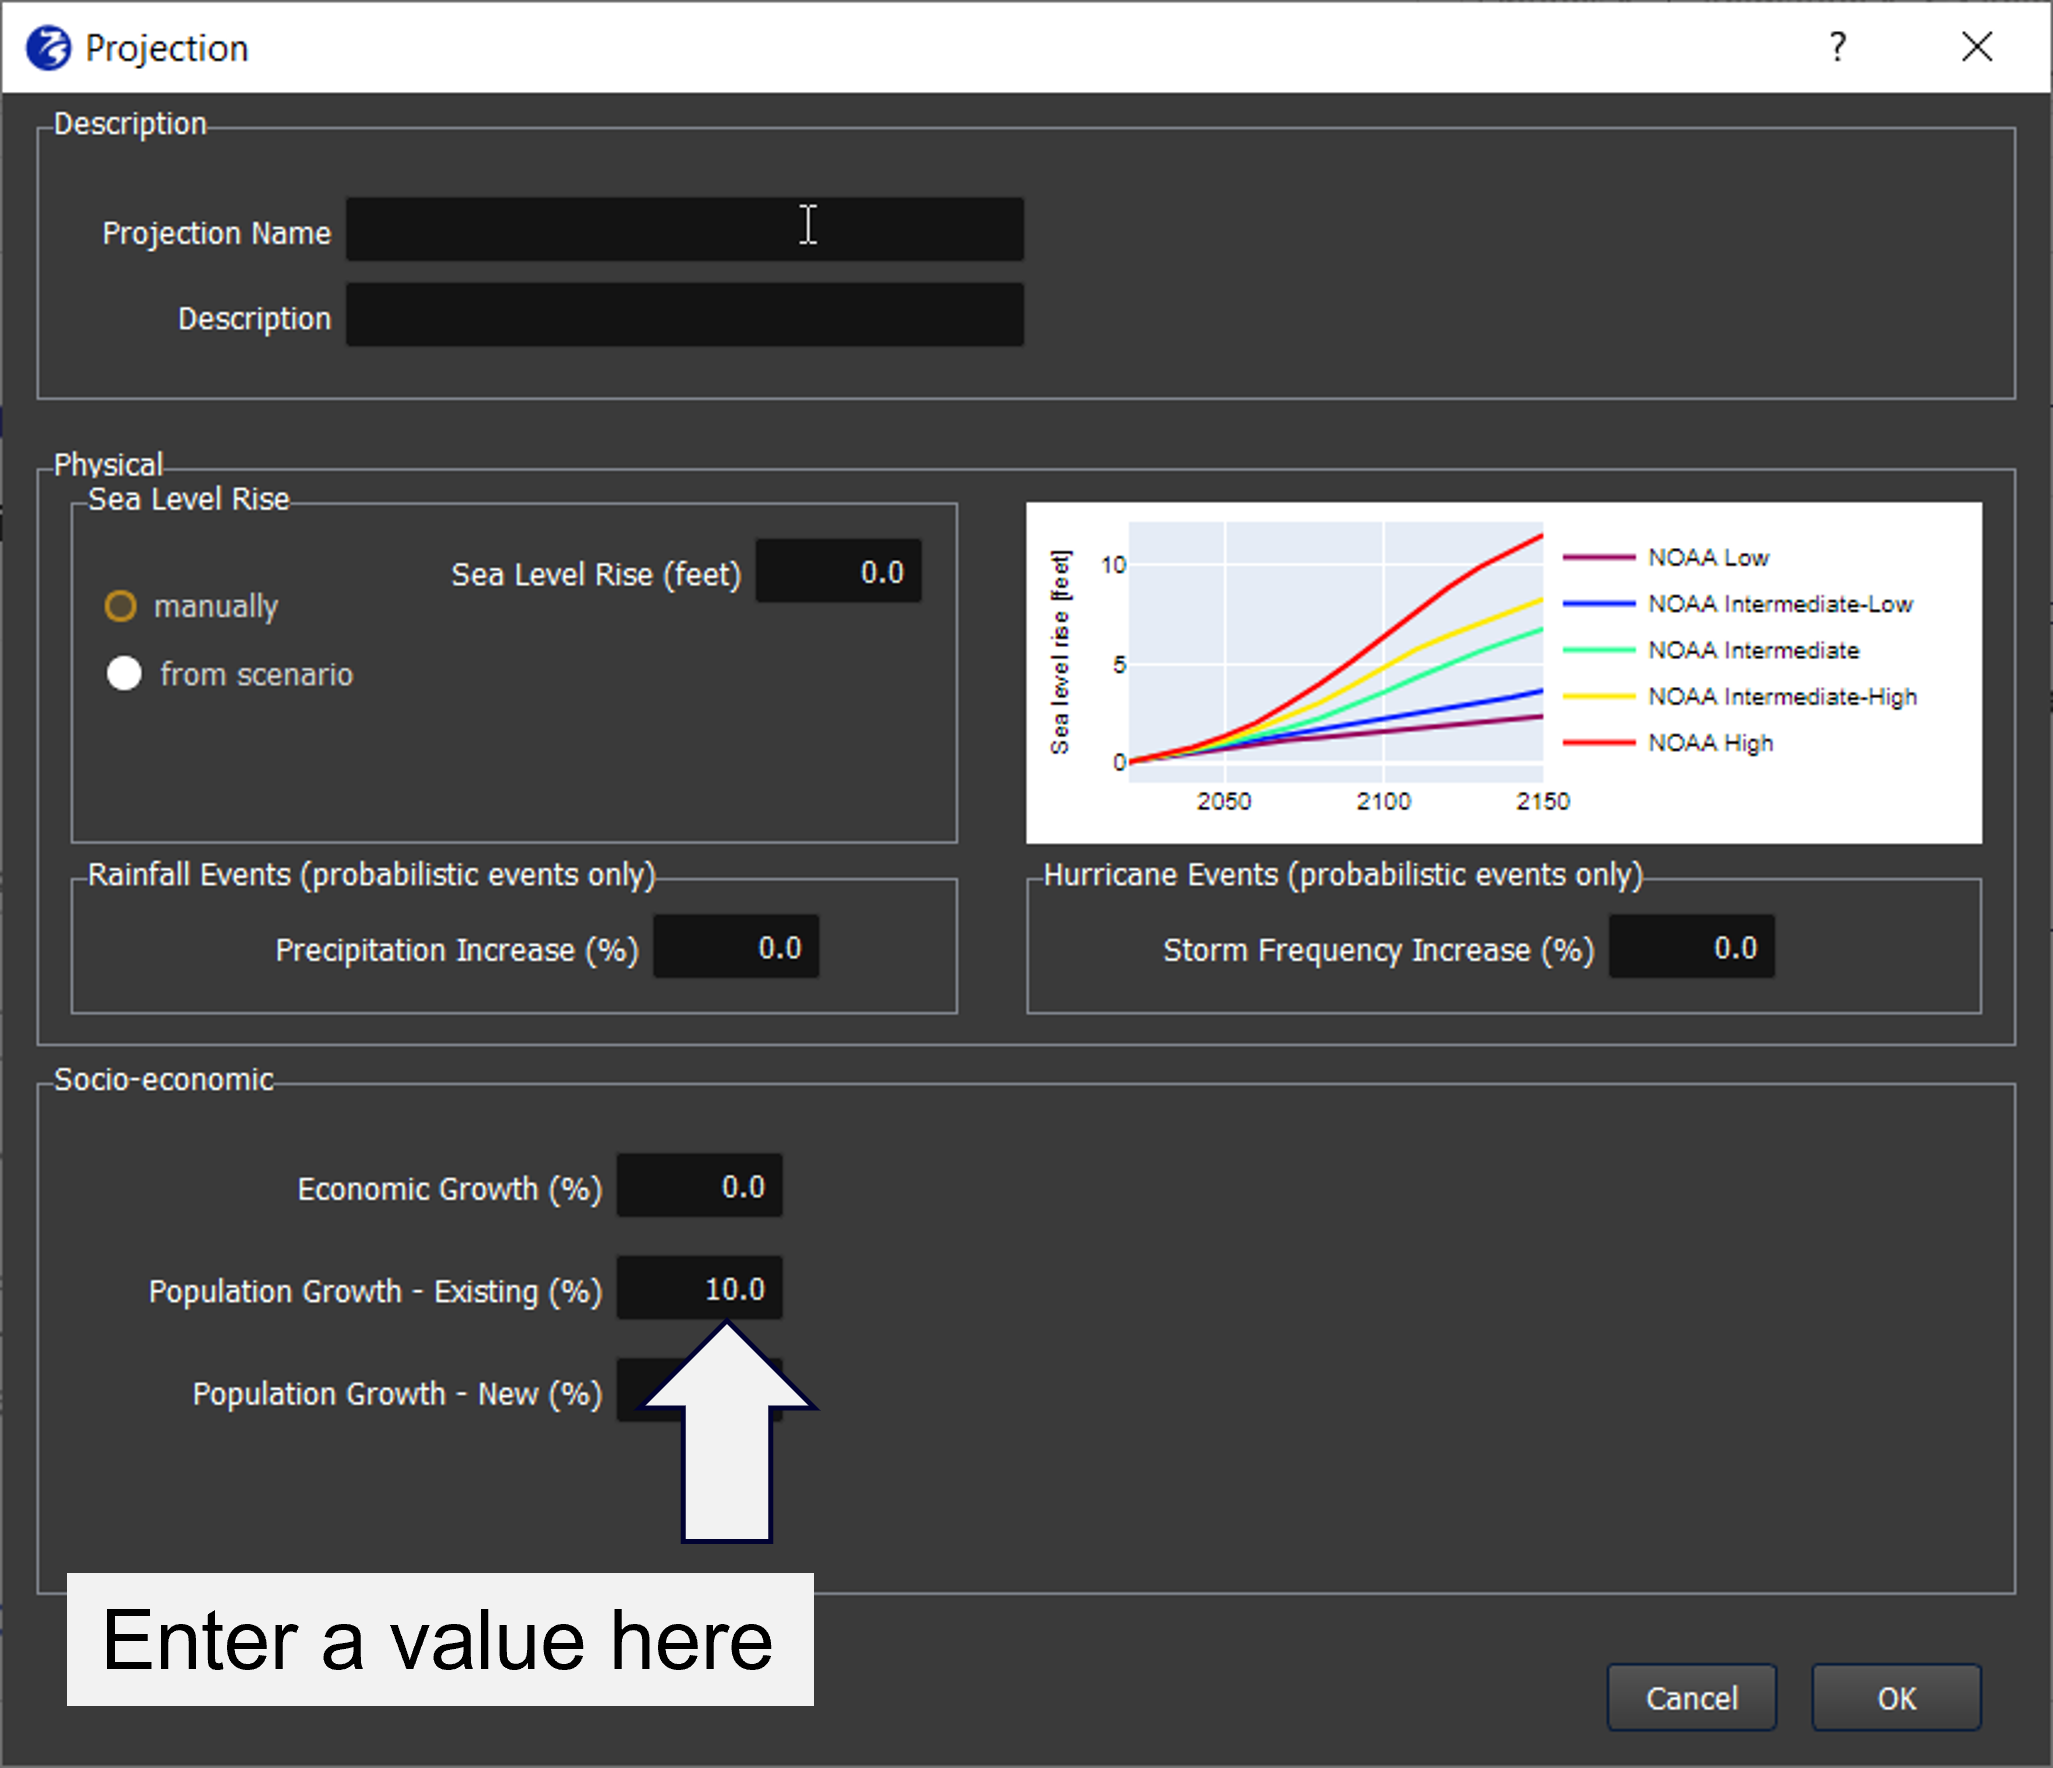
The idea of the population growth option in existing built areas within FloodAdapt is that the building stock becomes either more dense (more buildings), or the existing residences are replaced by higher-density buildings like apartment buildings.
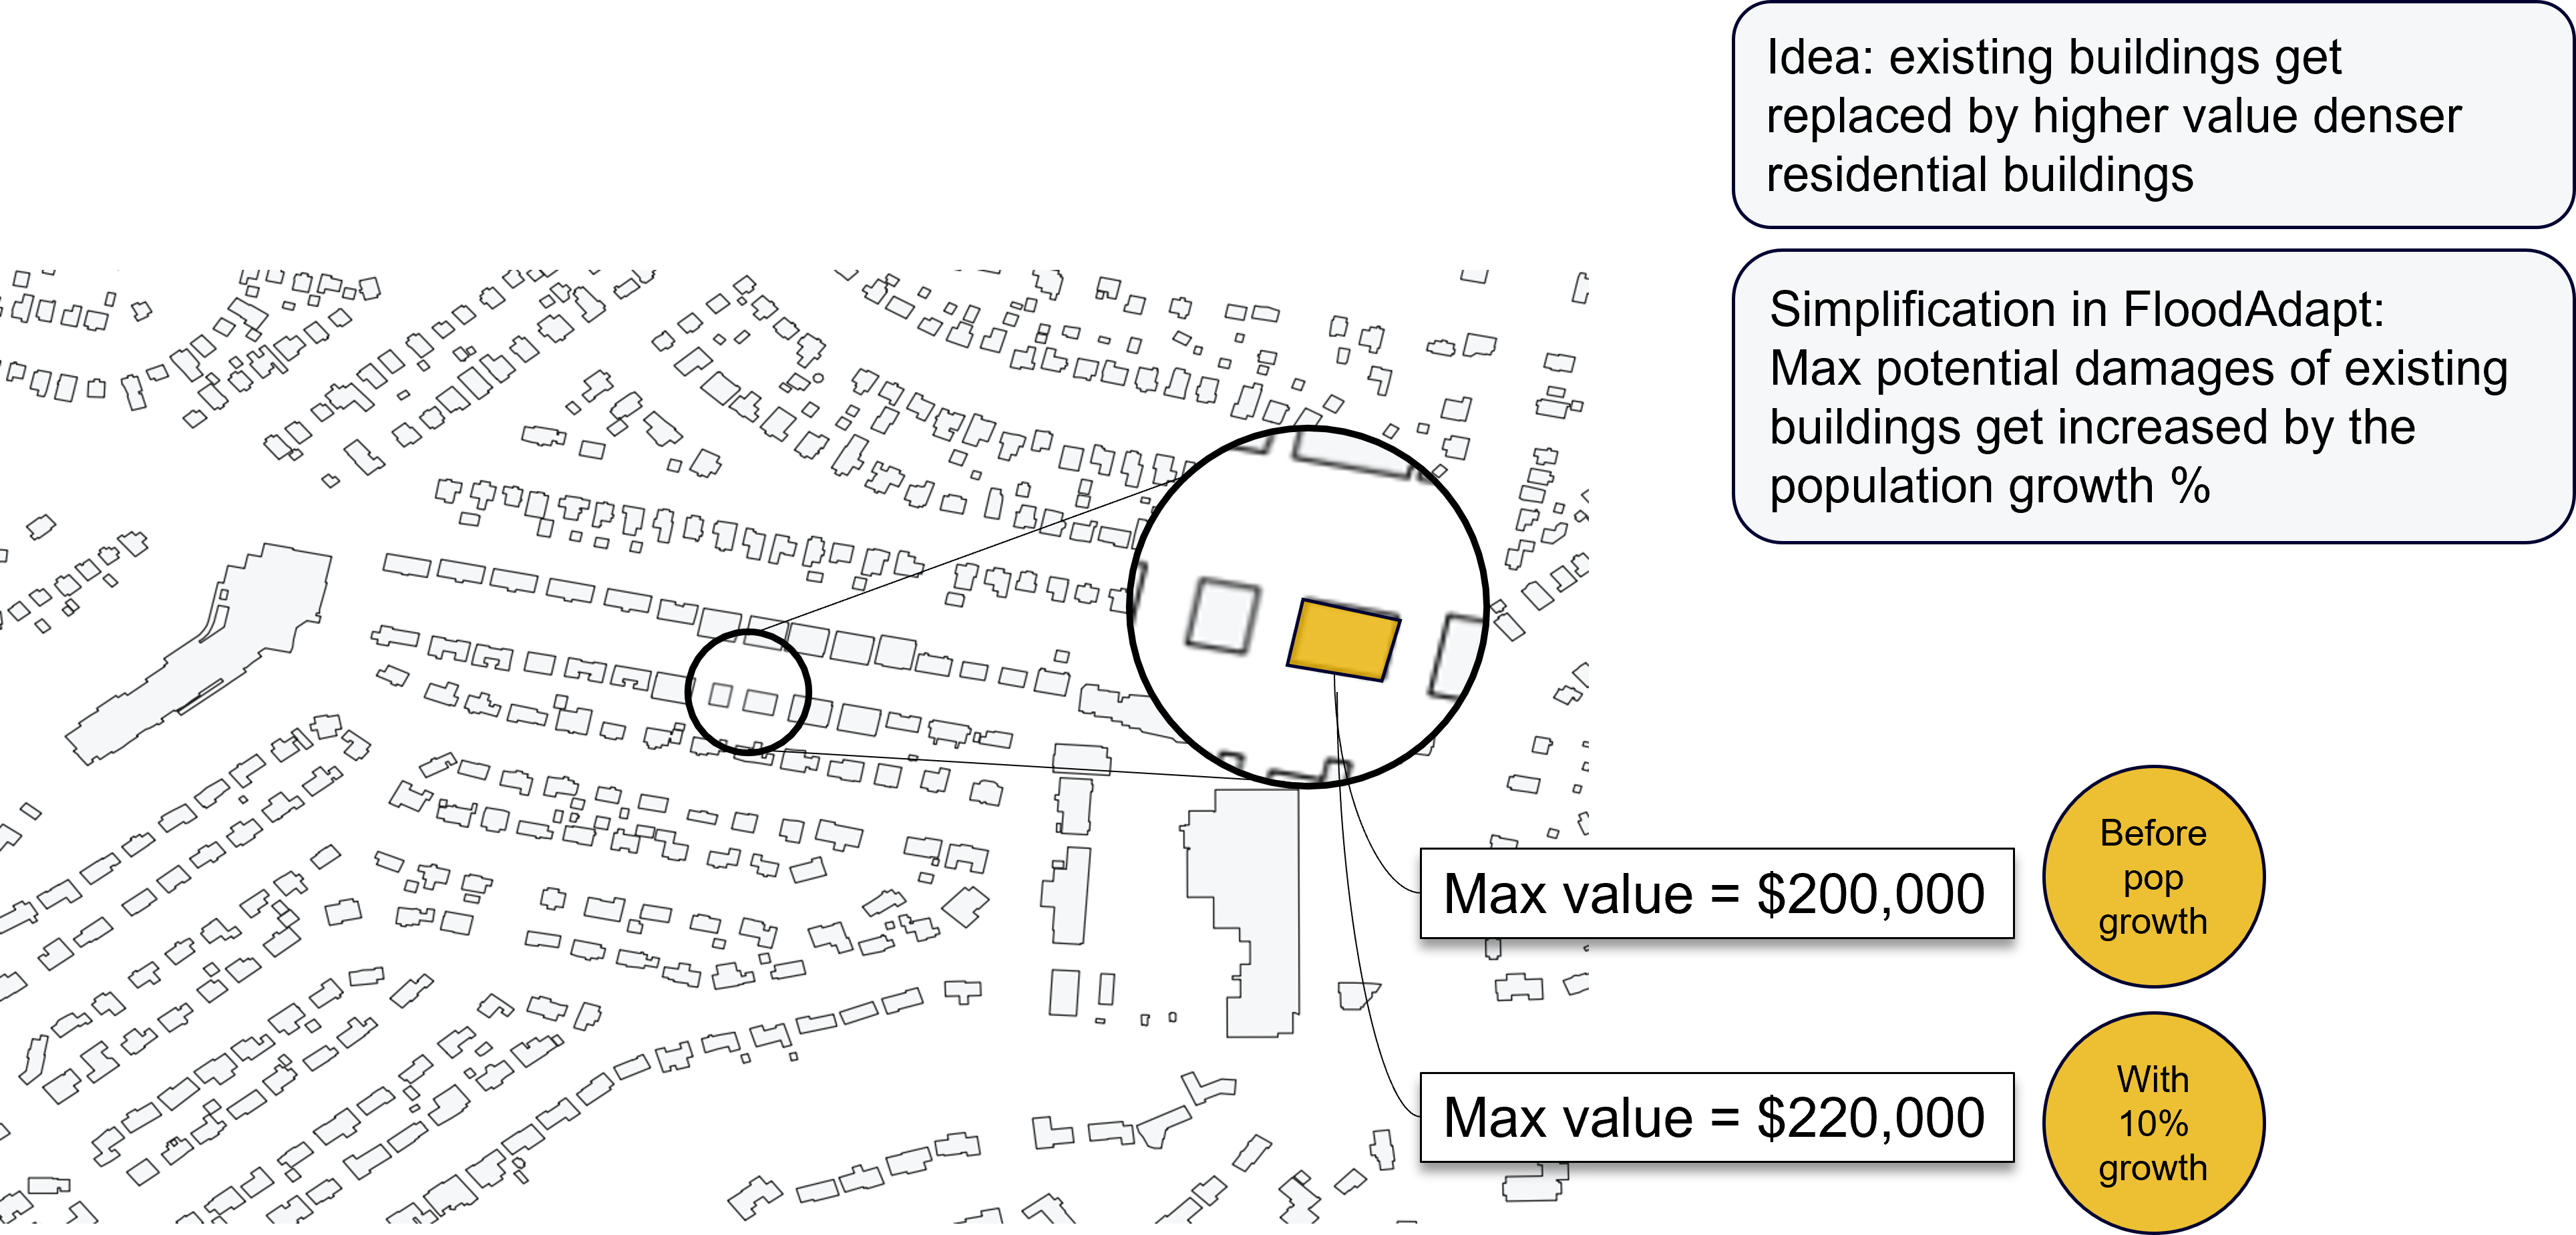
The implementation of population growthing within FloodAdapt is simplified. This is because users may not know where new buildings will be built or which buildings will be replaced by higher-density buildings to support future population growth. FloodAdapt therefore spreads the increase evenly over the entire building stock, by increasing the maximum potential damages of all the existing buildings. Figure 2 shows an example how this is implemented, highlighting one building. This increase is applied to all buildings equally, so that the overall increase in damages is reflective of the future situation with population growth.
Population growth - new development areas
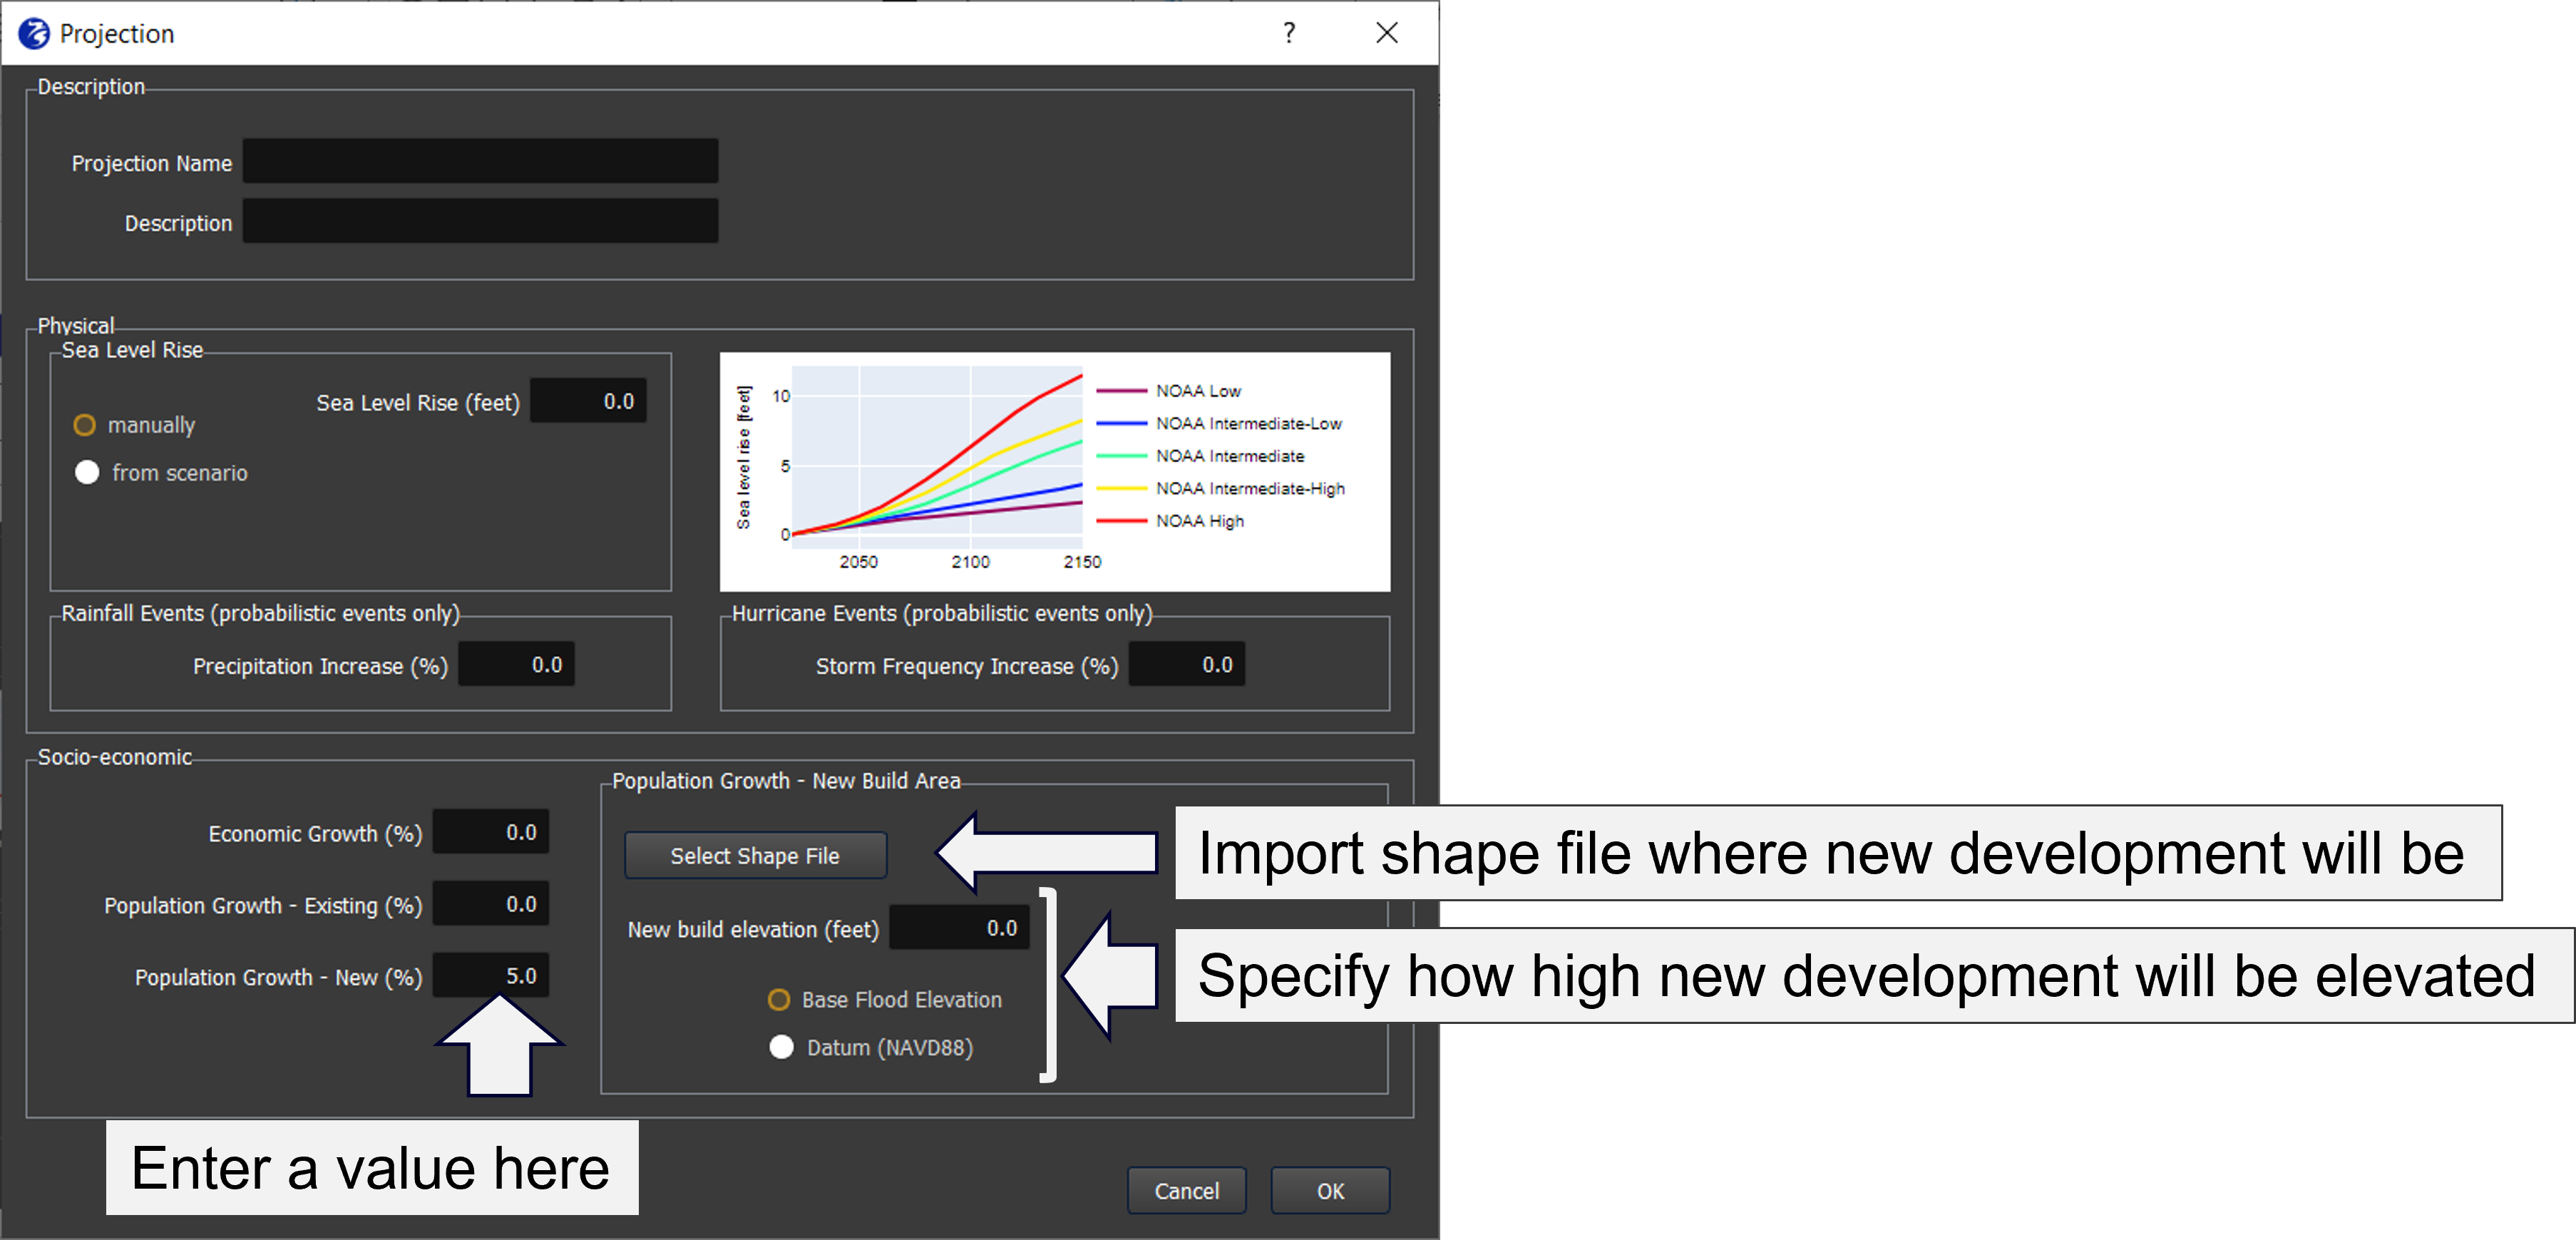
To evaluate future impacts of population growth specifically in new areas considered for development, users can choose the option “Population Growth - New (%)” (see Figure 3). This is an innovative feature of FloodAdapt which allows users to evaluate the flooding and impacts in areas considered for future development.
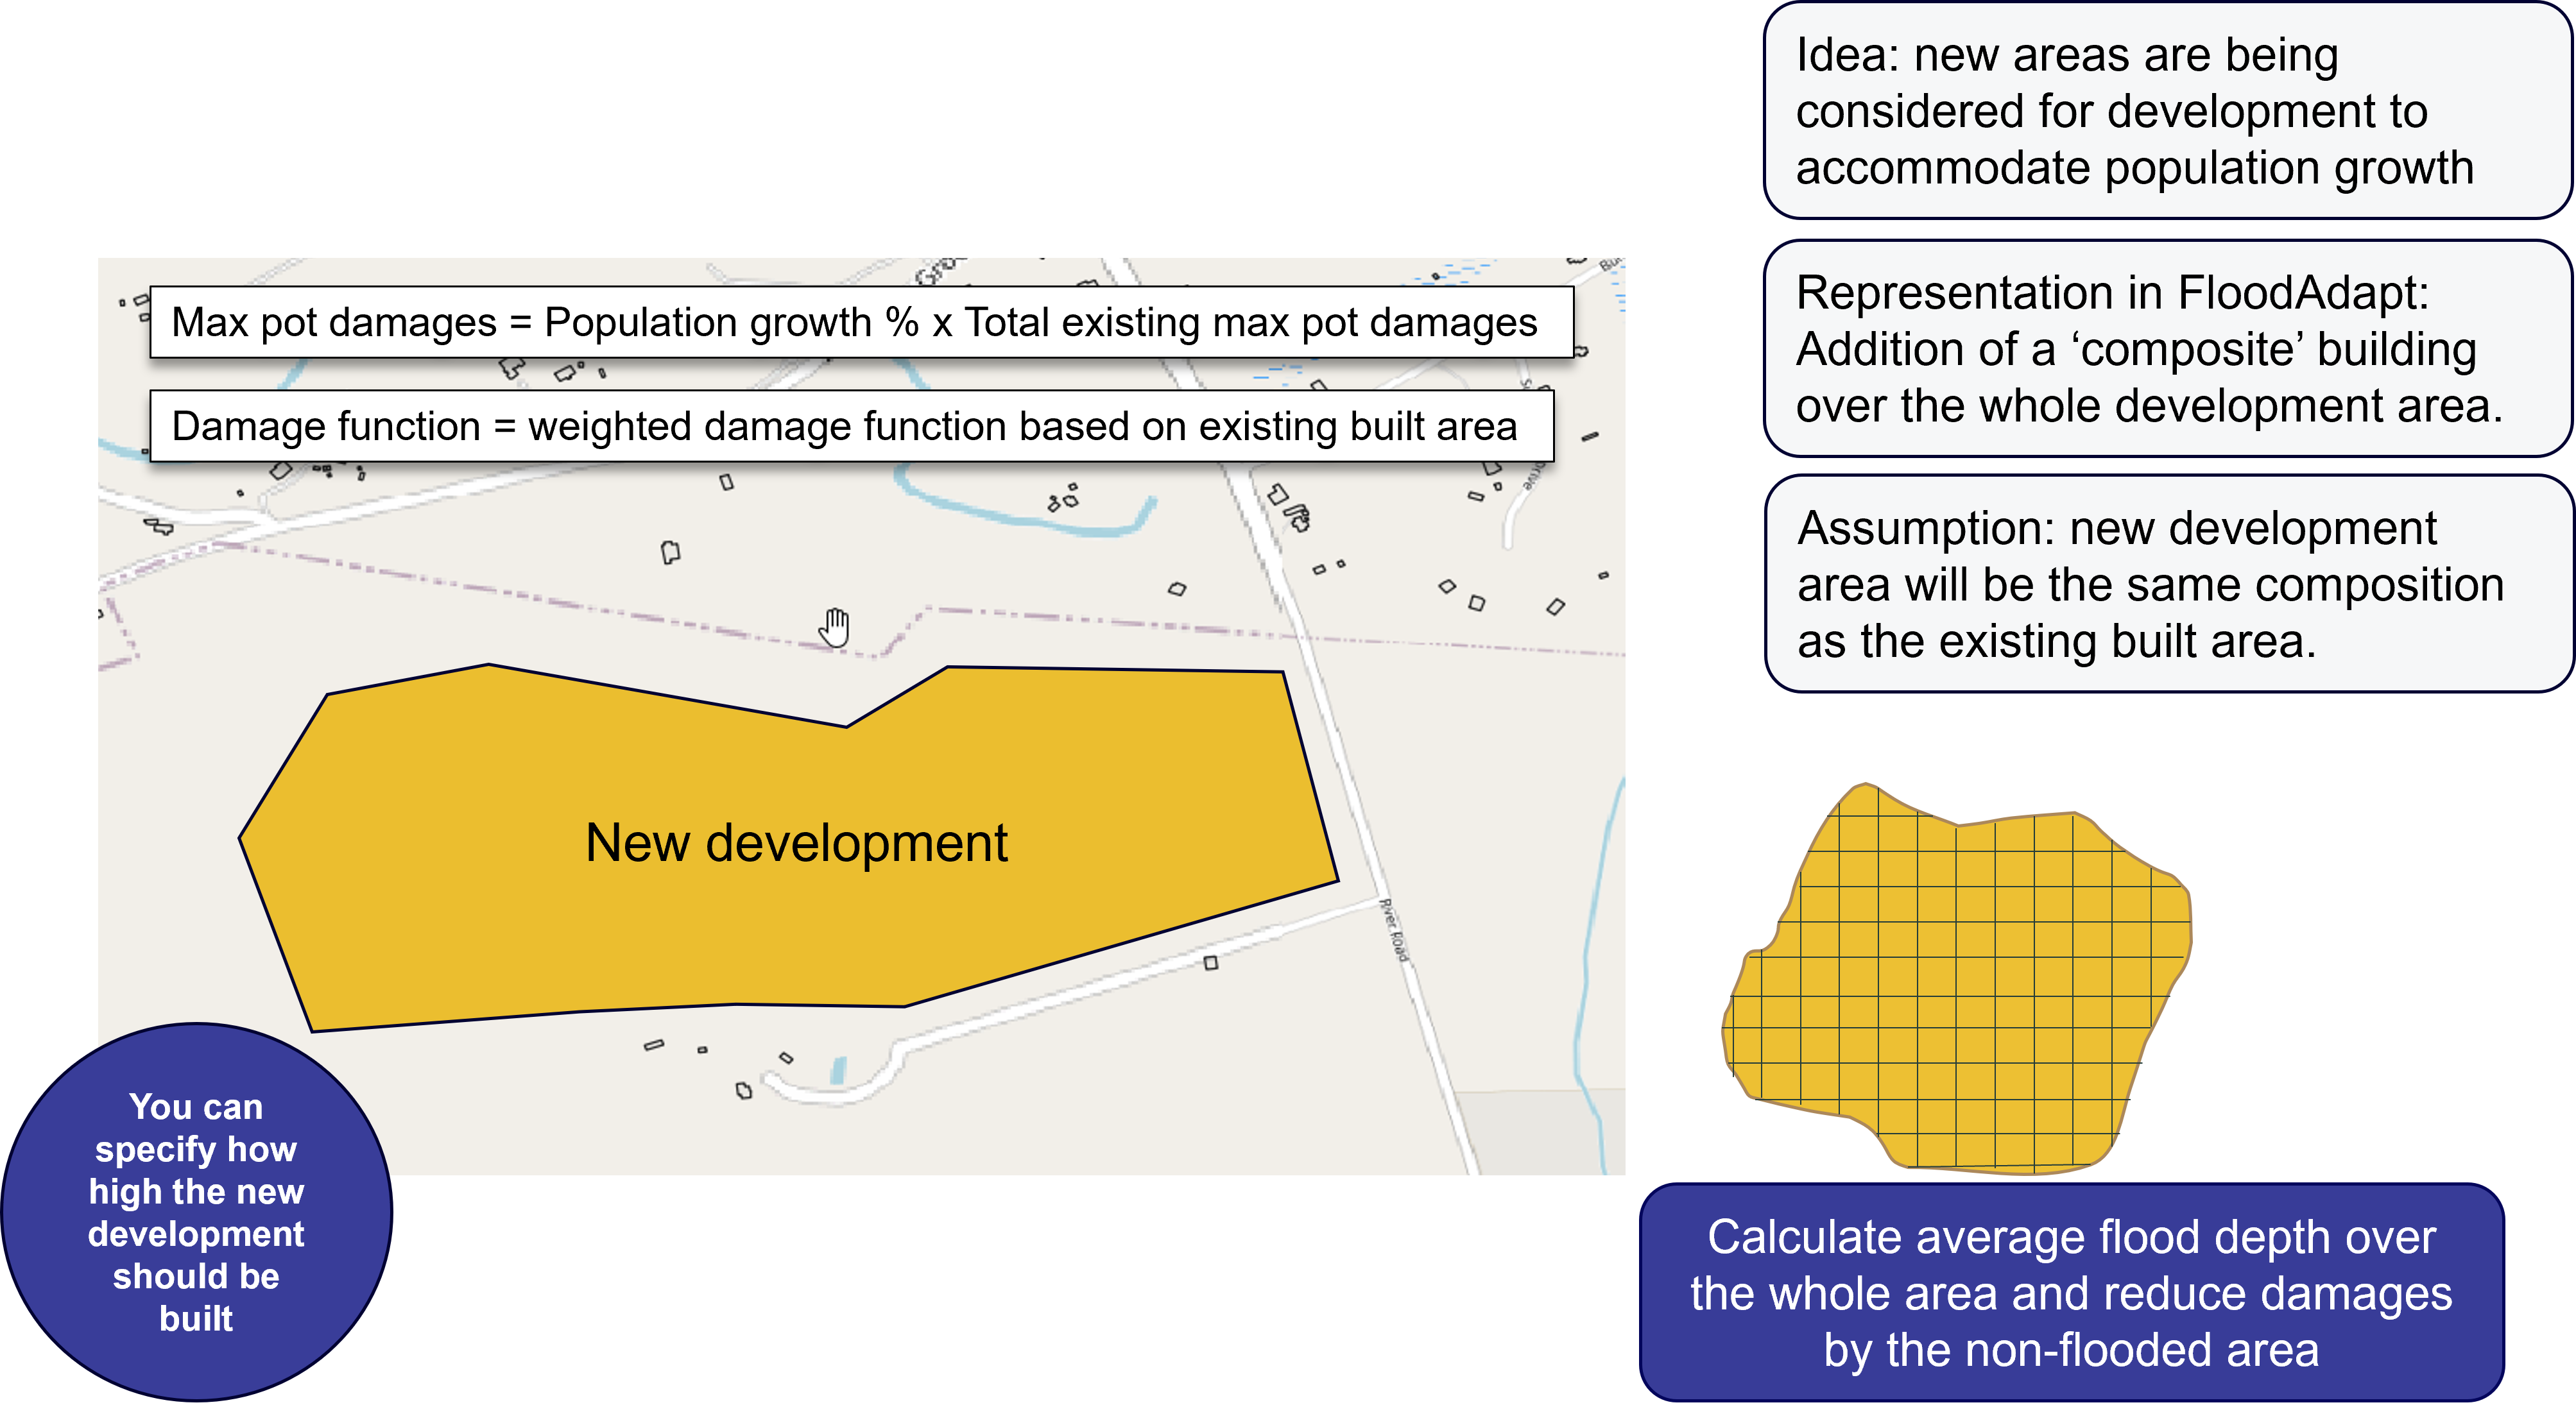
The user specifies the percentage of the current existing population that is projected to live in the new development area. For example, if the current population is 100,000, and the new development area is expected to support 1,000 new residents, the user would enter 1% for the population growth in the new area. The user is then asked to provide a shape file (or other spatial polygon file) specifying the boundaries of the new development area. In addition, the user can specify how high the new development will be built off the ground, either relative to a datum, or relative to base flood elevation (BFE). This allows users to explore the impact of regulations on how high new developments need to be built.
The idea of population growth in new areas in FloodAdapt is that people will move to currently-undeveloped areas which will be zoned for residential or commercial use to accommodate population growth. This feature allows users to evaluate potential new development areas in terms of the impacts and risk that result.
The implementation of population growth in new areas in FloodAdapt is simplified. The user is not expected to know exactly where each new building will be located, or specifics about each building that are typically needed to calculated damages, such as maximum potential damages, or whether they will be one-story or two-story homes. Instead, FloodAdapt creates a composite building over the entire new development area. This composite building is currently assumed to reflect the make-up of the existing built area. For example, if the current built area is 80% residential, 18% commercial, and 2% government buildings, the new development will have this same composition. The way this is utilized in FloodAdapt is that the composite new-development building is assigned a depth-damage curve that is a weighted average of the depth-damage curves of the existing buildings. The maximum potential damage of the composite building is assumed to be the total maximum potential damages over all the existing buildings multiplied by the percentage population growth. For example, if the total maximum potential damages over all buildings in the area is $1 Billion, the maximum potential damages for a new development area with 1% population growth would be $10 Million. Because the new-development composite building is large, it is likely often partially flooded during flood events. FloodAdapt stores the flood depths over the entire new development area. It takes the average flood depth to calculate damages, but reduces these damages by the fraction of the area that is not flooded. For example, if the average flood depth leads to damages of $1 Million, but only 20% of the area was flooded, FloodAdapt will reduce the damages by 80% to $200,000. Figure 4 gives a visual representation of how population growth in new development areas is represented in FloodAdapt.
Economic growth
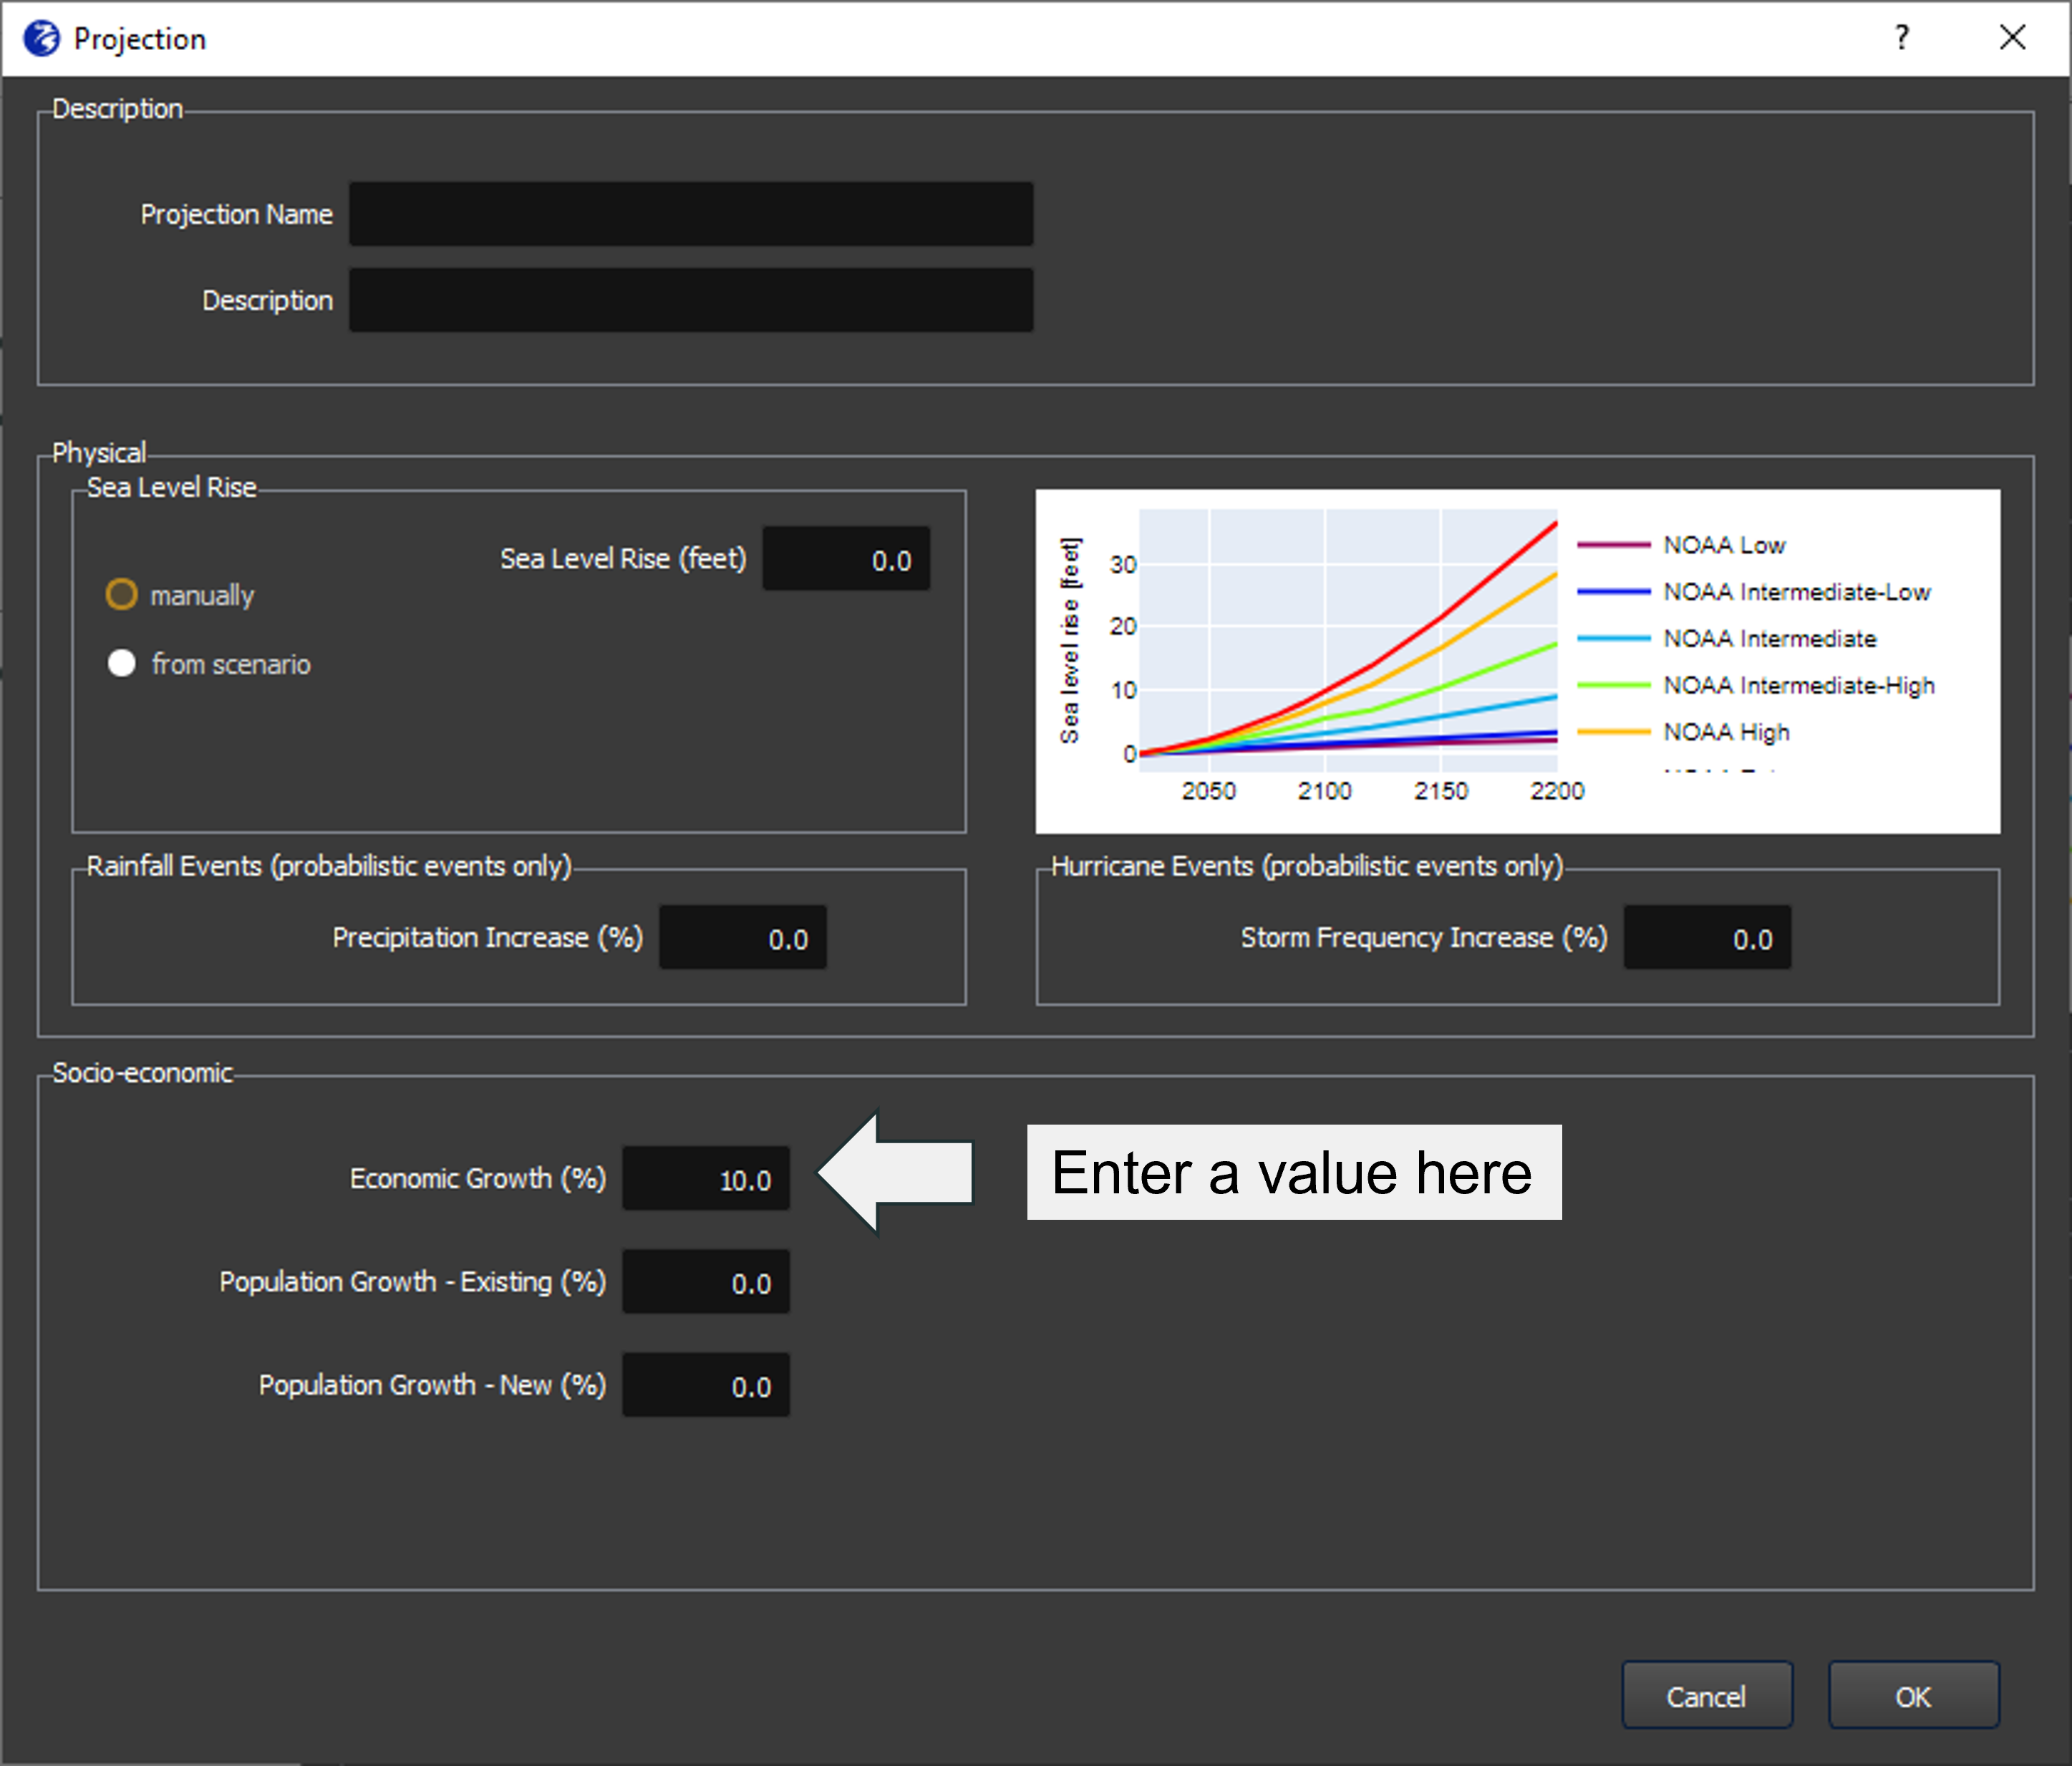
To evaluate economic growth, users can choose the option “Economic Growth (%)” (see Figure 5). The user enters a percentage increase in economic growth.
The economic growth projection is implemented in a simplified way in FloodAdapt by increasing the maximum potential damages of the existing buildings by the specified percentage. This is a simplification intended to represent increasing wealth and value in the community, without specifically accounting for changes in economic activity which would lead to this wealth and value increase.