Urban green infrastructure
Urban green infrastructure integrates natural elements like parks, green roofs, and permeable pavements into city landscapes to absorb, slow down, and manage stormwater runoff, thereby reducing flood risk and enhancing urban resilience. FloodAdapt includes a high-level representation of urban green infrastructure that is intended to help users identify the required capacity of urban green infrastructure solutions and the best placement of these options within the city to achieve community objectives. Currently there are three ‘flavors’ of urban green infrastructure that can be simulated and evaluated with FloodAdapt: water square, greening, and total storage. This section describes how these measures can be specified in FloodAdapt and how they are represented in the modeling.

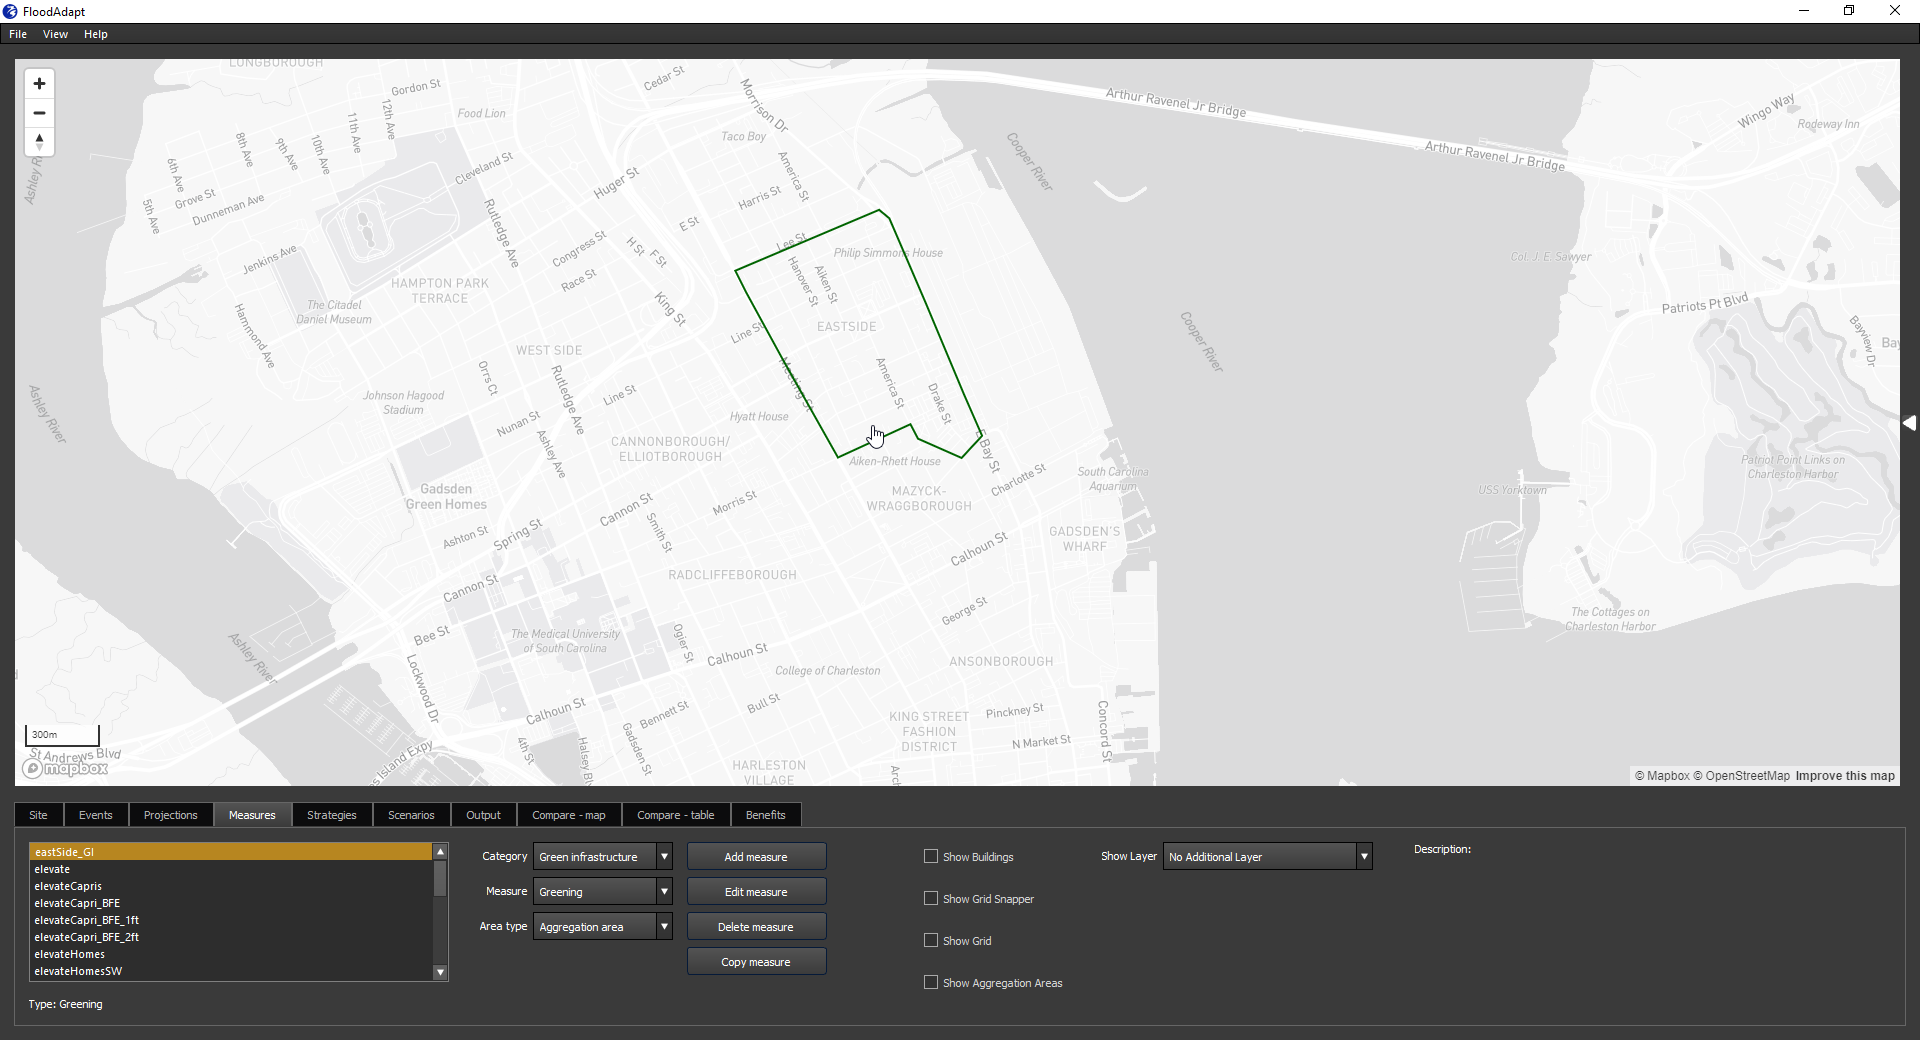
To specify a green infrastructure measure, go to the Measures tab, and in the “Category” drop-down menu select “Green infrastructure”. Then for “Measure” choose one of the three measure types: water square, greening, or total storage. Next, choose an “Area type”. This indicates how you will select the area to which you want to apply the green infrastructure measure. There are three options:
Draw polygon: click a polygon in the map to select the area
Aggregation area: apply the measure to an entire aggregation area, for example a neighborhood
Import polygon: import a polygon that has been made externally, for example in GIS software
When selecting an area to apply green infrastructure, it is useful to turn on the “show grid” option so you can see where the measure will be applied in the flood model.
FloodAdapt is intended to be used at a high level of green infrastructure planning, identifying where measures are most needed or would be most beneficial, and estimating the storage capacity needed to reach an objective. An objective could be something like “This neighborhood should not be flooded in a heavy rainfall we see on average twice a year”. The flood model in FloodAdapt is not fine-scaled enough to evaluate specific measures, like a permeable street or a few green roofs. The idea is that once you know where measures are needed and how much capacity they need to have, you would work with landscape architects to come up with design alternatives, and test those designs with a detailed model. For this approach, we recommend the total storage option. However, if you already have a green infrastructure plan in mind and you want to test it (approximately) for different rainfall events, you can use the greening option, or - in case of water squares specifically - the water square option.
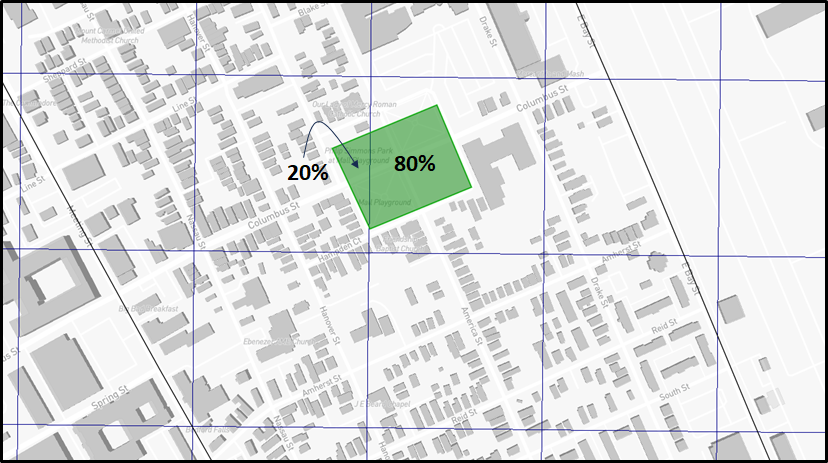
All the green infrastructure measure types in FloodAdapt are represented in the modeling in the same way. The total storage volume from the green infrastructure is added to the underlying flood model in the cells where the green infrastructure is placed. When green infrastructure is implemented over multiple flood model cells, the volume is distributed over the cells proportionally according to their share of the green infrastructure area. For example, in the figure below, 80% of the storage volume would go into the cell with 80% of the area, and 20% would go to the cell with 20% of the area. When you run a scenario, the flood model removes water entering the cells where green infrastructure is placed until the storage volume for that cell has been reached. Note that the storage volume in each cell is handled uniformly throughout the cell, so you may have flood reductions in areas within the cell but outside the green infrastructure polygon.
Water Square
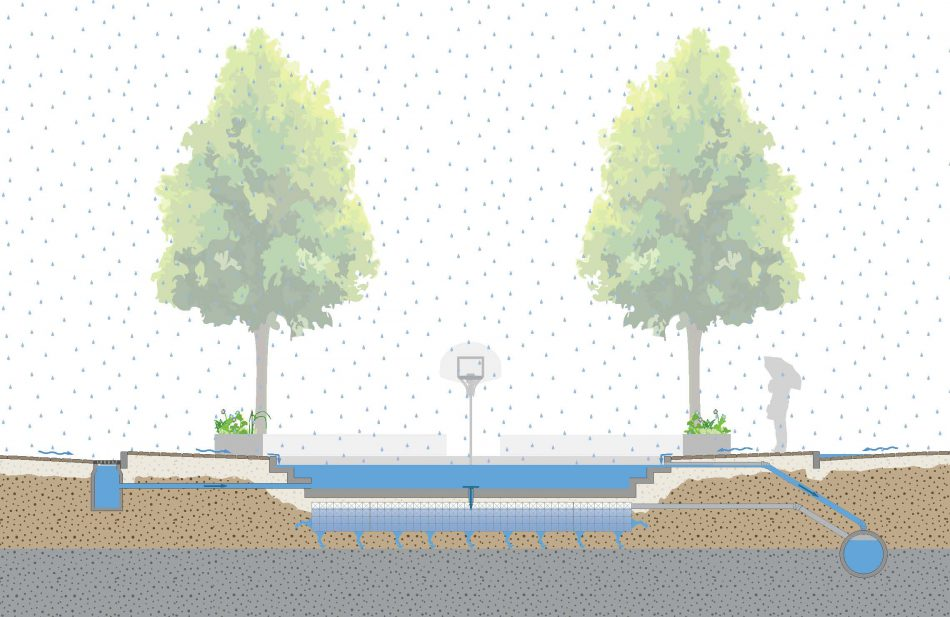
A water square is a multi-functional urban space designed to temporarily store excess rainwater during heavy rainfall, reducing flooding while providing recreational and aesthetic benefits during dry periods. A schematic of a water square is shown in Figure 2.
To implement a water square in FloodAdapt:
- Go to the Measures tab
- Select “Green infrastructure” for the Category
- From the Measure drop-down menu, select “Water square”
- Select one of the “Area Type” options and then click “Add Measure”
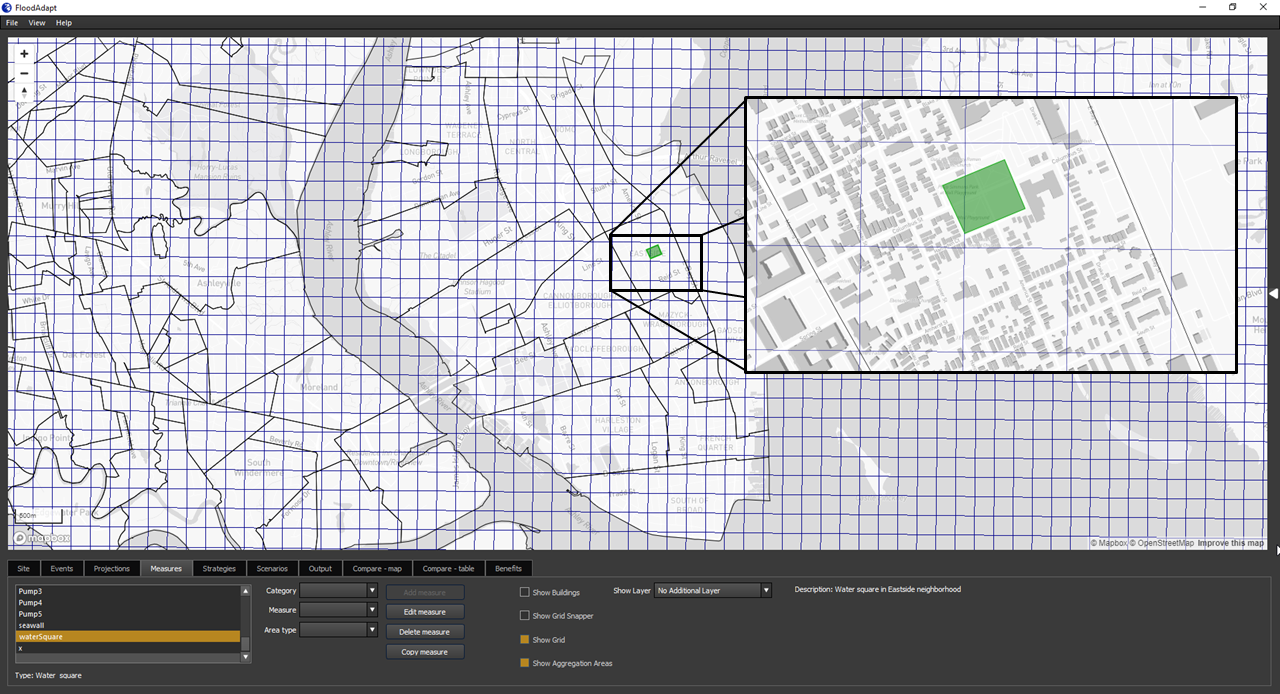
If you selected “Draw Polygon”, you can now begin drawing the polygon that represents the shape of your water square. It is useful to turn on the “show grid” option so you can see where your water square will be implemented in the flood model. Figure 3 shows an implementation of a water square in FloodAdapt. In this example, the water square is implemented over two flood model grid cells, so those cells will have a higher storage capacity because of the water square. When you have finished drawing your polygon, you can double click to open the specification window. If you select “Aggregation area” or “Import polygon” to define your water square area, the specification window will open immediately when you click “Add measure”, and you will additionally be asked to specify the aggregation area or to upload your polygon as a spatial file, depending on what you chose.
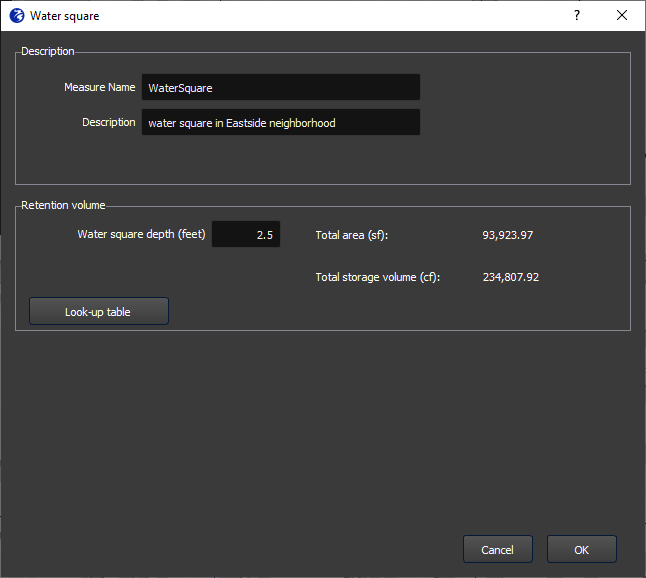
The specification window is shown in Figure 8. In this window, you enter a name for the measure (no spaces or special characters), an optional description, and the depth of the water square. After entering the depth, click Enter. FloodAdapt will then automatically calculate the area of the water square (based on the selected area for the water square) and the total storage volume by multiplying the area with the specified water square depth. Additionally, there is also a “Look-up table” button. This shows suggestions for infiltration depths for different types of green infrastructure measures; see Figure 5. For the water square measure type, only the entry about water squares would be relevant.
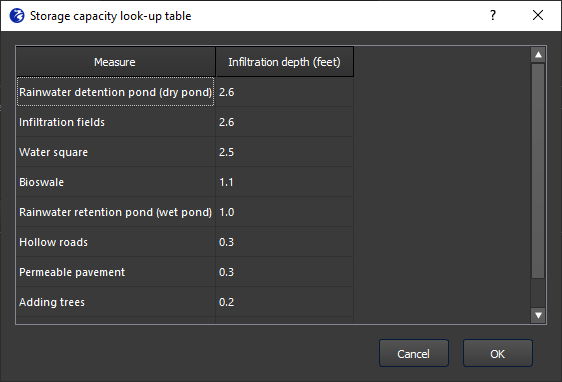
The suggested infiltration depths in the green infrastructure lookup-table are based on the default values used in the Climate Reilient Cities Tool, which itself based these values on different sources in literature. Users are free to choose their own infiltration depth when they have more information, but the suggestions are intended to help users who may not know this information but already want to start high-level exploring of green infrastructure solutions in their community.
Greening
Greening in FloodAdapt refers to the implementation of a collection of different types of individual measures that may be part of a green infrastructure design. This option allows you to specify an area and the percentage of that area where green infrastructure will be implemented. For example, let’s say the area of interest is a neighborhood, and the measure under consideration is a bioswale. In this case, you could estimate the area of the neighborhood where there are roads (for example, let’s say 10%), and then specify that 10% of the area will have an infiltration depth appropriate for a bioswale (see the lookup table shown in Figure 5).
To implement the greening option in FloodAdapt:
- Go to the Measures tab
- Select “Green infrastructure” for the Category
- From the Measure drop-down menu, select “Greening”
- Select one of the “Area Type” options and then click “Add Measure”
If you selected “Draw Polygon”, you can now begin drawing the polygon for the area where you want to apply green infrastructure. When you have finished drawing your polygon, you can double click to open the specification window. If you select “Aggregation area” or “Import polygon” to define your area, the specification window will open immediately when you click “Add measure”, and you will additionally be asked to specify the aggregation area or to upload your polygon as a spatial file, depending on what you chose.
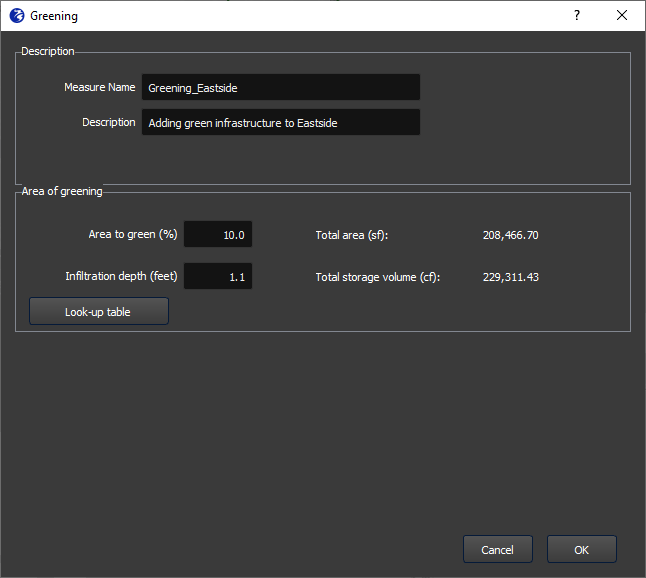
The specification window is shown in Figure 8. In this window, you enter a name for the measure (no spaces or special characters), an optional description, the percent of the selected area you wish to apply green infrastructure measures, and the infiltration depth of the measures. For this last entry, you can use the Look-up table (see Figure 5). This shows suggestions for infiltration depths for different types of green infrastructure measures. After entering the depth, click Enter. FloodAdapt will then automatically calculate the area where the green infrastructure will be applied (based on the selected area and the percent area to green) and the total storage volume by multiplying the green infrastructure area with the specified infiltration depth.
Total storage
Total storage is the most appropriate option for high-level strategic planning of green infrastructure. It addresses key questions such as, “Where should we implement green infrastructure?” and “How much storage capacity do we need?” This green infrastructure option involves selecting an area and specifying a total increased storage volume from green infrastructure measures, without focusing on specific measures. This approach allows you to explore different storage capacities and identify what storage capacity you need to meet your planning targets. It also allows you to test out storage in different neighborhoods and see where you get the best result for different rainfall events. This can help give direction to landscape architects, who can look into more detail how to obtain the required storage in different areas of the city. Of course, it is always recommended to verify the increase in storage with more detailed models in the design phase.
To implement the Total storage option in FloodAdapt:
- Go to the Measures tab
- Select “Green infrastructure” for the Category
- From the Measure drop-down menu, select “Total storage”
- Select one of the “Area Type” options and then click “Add Measure”
If you selected “Draw Polygon”, you can now begin drawing the polygon for the area where you want to apply green infrastructure. When you have finished drawing your polygon, you can double click to open the specification window. If you select “Aggregation area” or “Import polygon” to define your area, the specification window will open immediately when you click “Add measure”, and you will additionally be asked to specify the aggregation area or to upload your polygon as a spatial file, depending on what you chose.
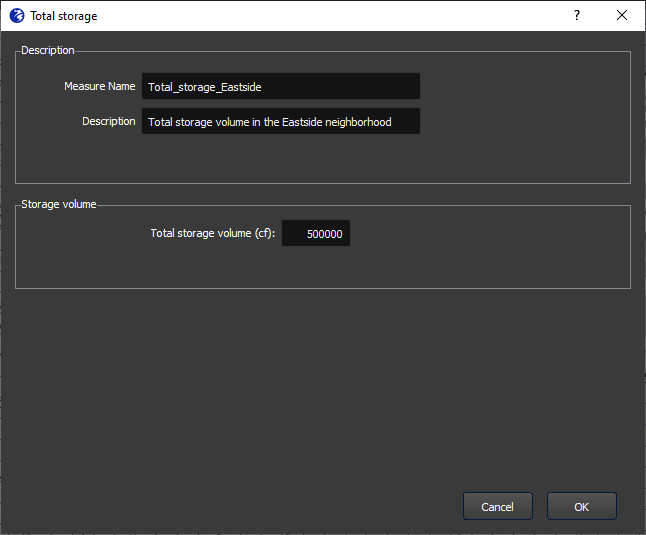
The specification window is shown in Figure 9. In this window, you enter a name for the measure (no spaces or special characters), an optional description, and the total increased storage volume.