Climate projections
This section will describe how future projections of sea level rise, precipitation and tropical storm frequencies are specified and implemented in FloodAdapt.
Sea level rise
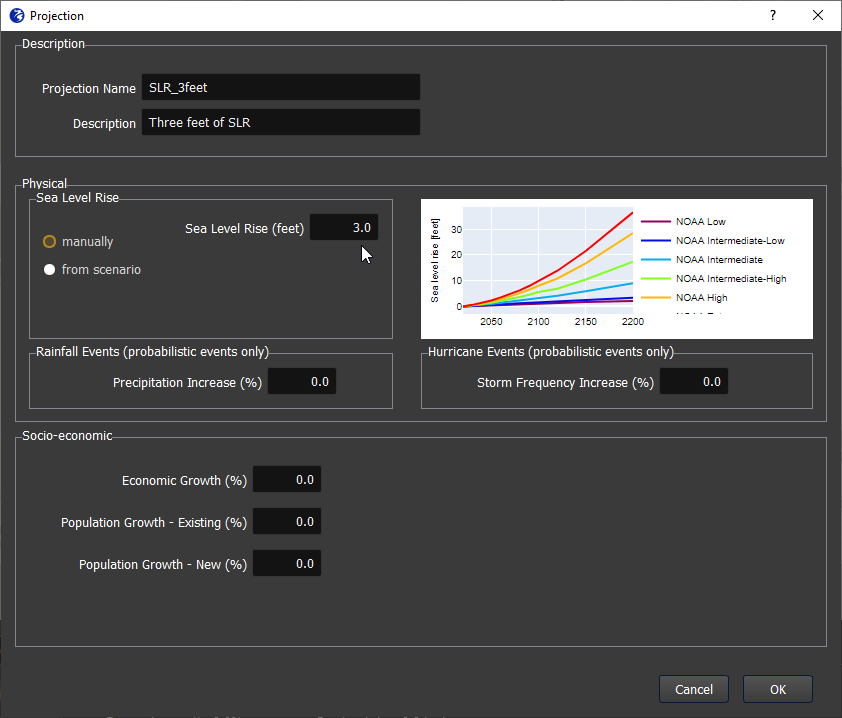
There are two ways to specify sea level rise in the projections window: manually and from scenario.
If you select manually, you can type a number in the “Sea Level Rise” (see Figure 2). You can then give your projection a name and (optionally) a description and click “OK” and your projection will show up in the FlodoAdapt Projections tab.
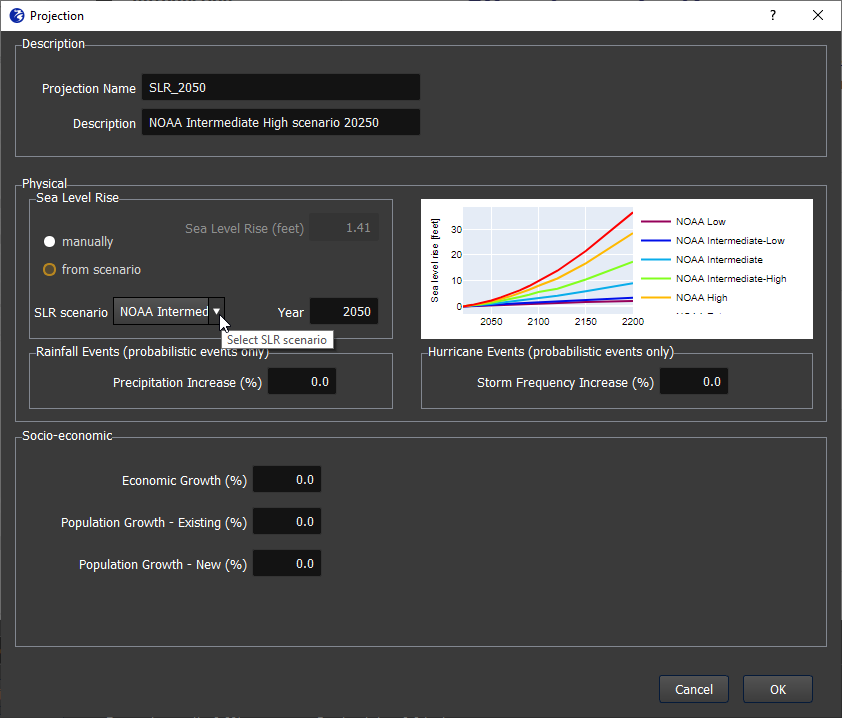
If you select from scenario, a dropdown box will appear from which you can select the sea level rise scenario you want to use (see Figure 3). These options are configurable and are specified at system setup. Once you select a scenario, you specify a year and FloodAdapt will automatically calculate the sea level rise for that year, using the selected sea level rise scenario. You can then give your projection a name and (optionally) a description and click “OK” and your projection will show up in the FlodoAdapt Projections tab.
Sea level rise scenarios have a starting point where sea level rise is zero (often, but not necessarily, starting at the year 2000). FloodAdapt corrects for this, using the ‘current year’, which is specified at system setup. So when a user chooses the “from scenario” option to input a sea level rise projection for a future year, the sea level rise that is shown in the projections window is relative to the current year. This is done by subtracting the projected rise between the starting point and the current year, for each sea level rise scenario.
When a user runs a scenario with a sea level rise projection, the sea level rise is added to the flood model’s coastal boundary condition. FloodAdapt treats this addition differently depending on the type of event. For a recent event using gauged water levels, the sea level rise in the current year relative to mean sea level is already represented in the measured water levels, so only the relative rise between the current year and future year is added. For a recent event without gauged water levels and for a historical hurricane, the offshore model calculates the nearshore coastal water levels relative to mean sea level. To correct for the sea level rise in the current year relative to mean sea level, an ‘offset’ is added which is specified at system set-up. On top of this, the relative sea level rise between the current year and the future year is added to represent the future conditions.
Increased precipitation
An increase in precipitation is given as a percentage in the projections window (see Figure 4). You can give the projection a name and (optionally) a description and click “OK” and the projection will be added in the projections tab.
Why is this only for probabilistic event sets?
In the projection window, you see an indication that increased precipitation is for probabilistic events only. This is because for a single event, a user can explore a ‘what-if’ scenario about increased rainfall by adjusting the rainfall when they define an event (with the precipitation magnifier for a historical event, or with complete flexibility in defining rainfall for a synthetic event). For probabilistic event sets, the precpitation change needs to be applied to every event in the set, something that the user cannot do via the events tab.
If you choose a projection of increased precipitation for a single event, it will work exactly as expected, and is identical to the precipitation magnifier option when you define your event. If you prefer to specify the increased precipitation via the projections tab instead of as a precipitation magnifier in the event tab, that is completely fine! Just be careful not to choose both, or the increase will be applied twice.

Increased storm frequency
An increase in storm frequency is given as a percentage in the projections window (see Figure 5). This percentage is treated as an increase in the occurrence frequency of each tropical storm event in a probabilistic event set. This influences the return period flood maps and risk estimates, because when storms occur more frequently, the chance of storm flooding, and hence risk, increases.
For example, if you select a storm frequency increase of 10%, and a tropical storm in the event set had an occurrence frequency of once in 50 years (0.02), the increased frequency of this storm would be 0.022, or once in about 45 years.
Why is this only for probabilistic event sets?
The change in storm frequency will only affect the frequency of the storm. This frequency is used in the derivation of return period flood maps and the calculation of expected annual damages. For a single event, this frequency is not used.
If you choose a projection of increased storm frequency for a single event, it will have no effect. The frequency is only used when calculating return period flood maps and risk, and for a single event scenario will play no role. It won’t do any harm, but it won’t have any effect on the resulting event-scenario flood and impact results.
