Site tab
Don’t feel like reading? No problem! Check out our video about the FloodAdapt site tab:
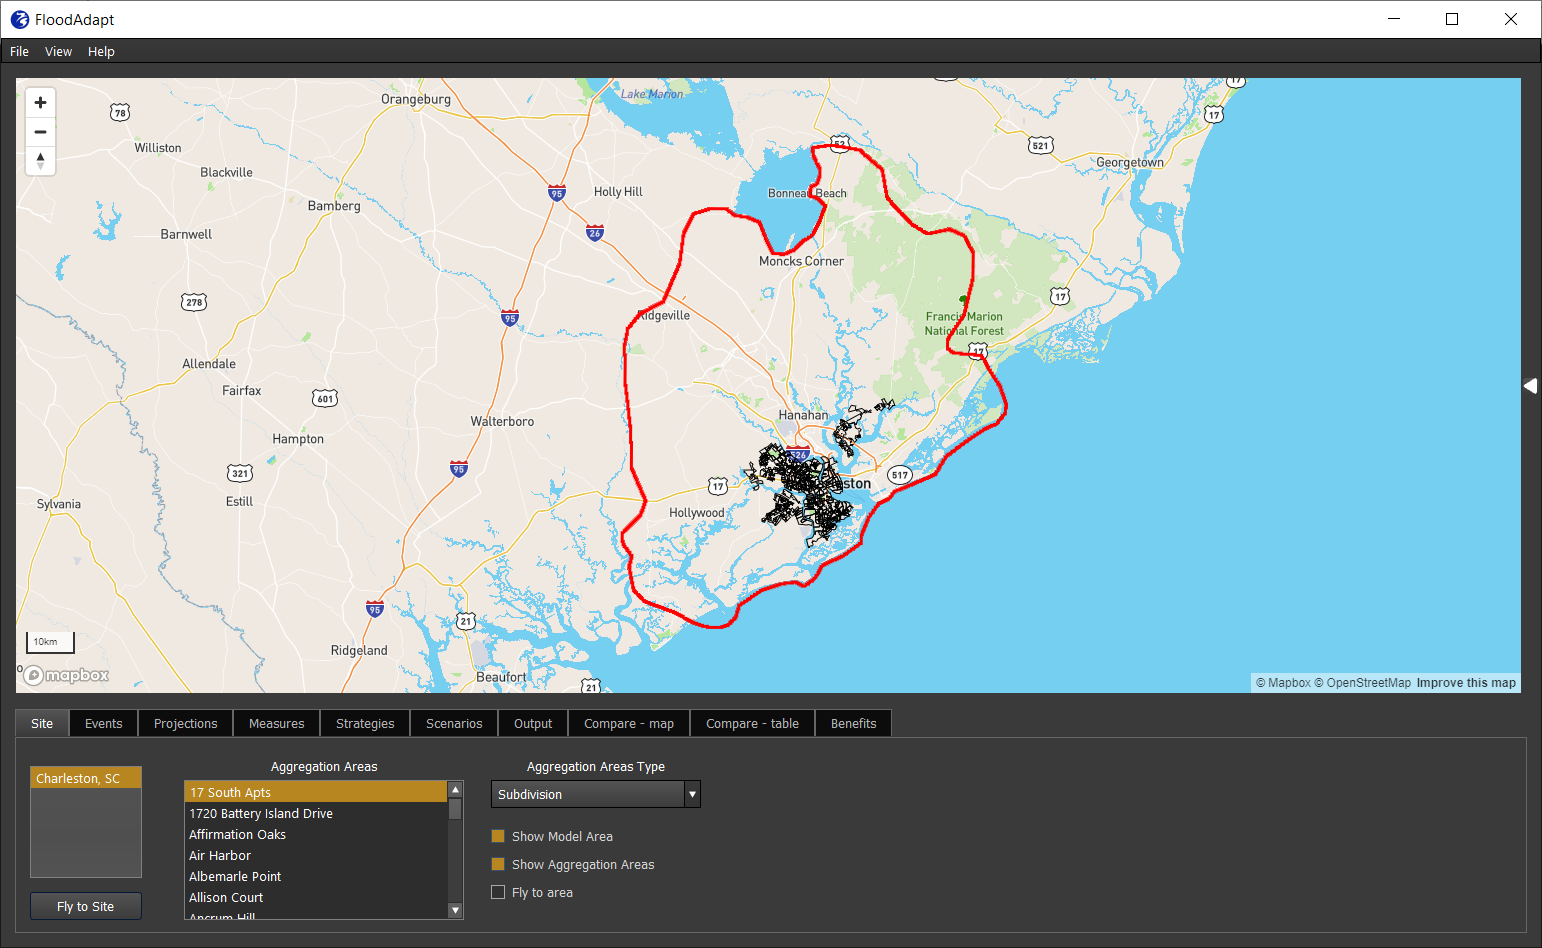
The user interface opens by default to the Site tab, shown for the example of Charleston, South Carolina in Figure 1. The site tab shows the aggregation areas that have been defined for the site. If more than one type of aggregation area has been defined, the user can select which one they want to view from the drop-down box ‘Aggregation Areas Type’. Examples of aggregation area types are census blocks, neighborhoods, or zip codes. The ‘Aggregation Areas’ box populates with the different areas for the selected aggregation type. The user can hover over an area and see the name of that area. Similarly, they can select an area of the ‘Aggregation Areas’ list and that area will become highlighted on the map.

The site tab also shows the extent of the flood model. This can be substantially larger than the area of interest. If a user zooms out they can see the extent of the area, as show in Figure 2