Historical event with gauged water levels
Don’t feel like reading? No problem! Check out our video about how to add a historical (gauged) event in FloodAdapt.
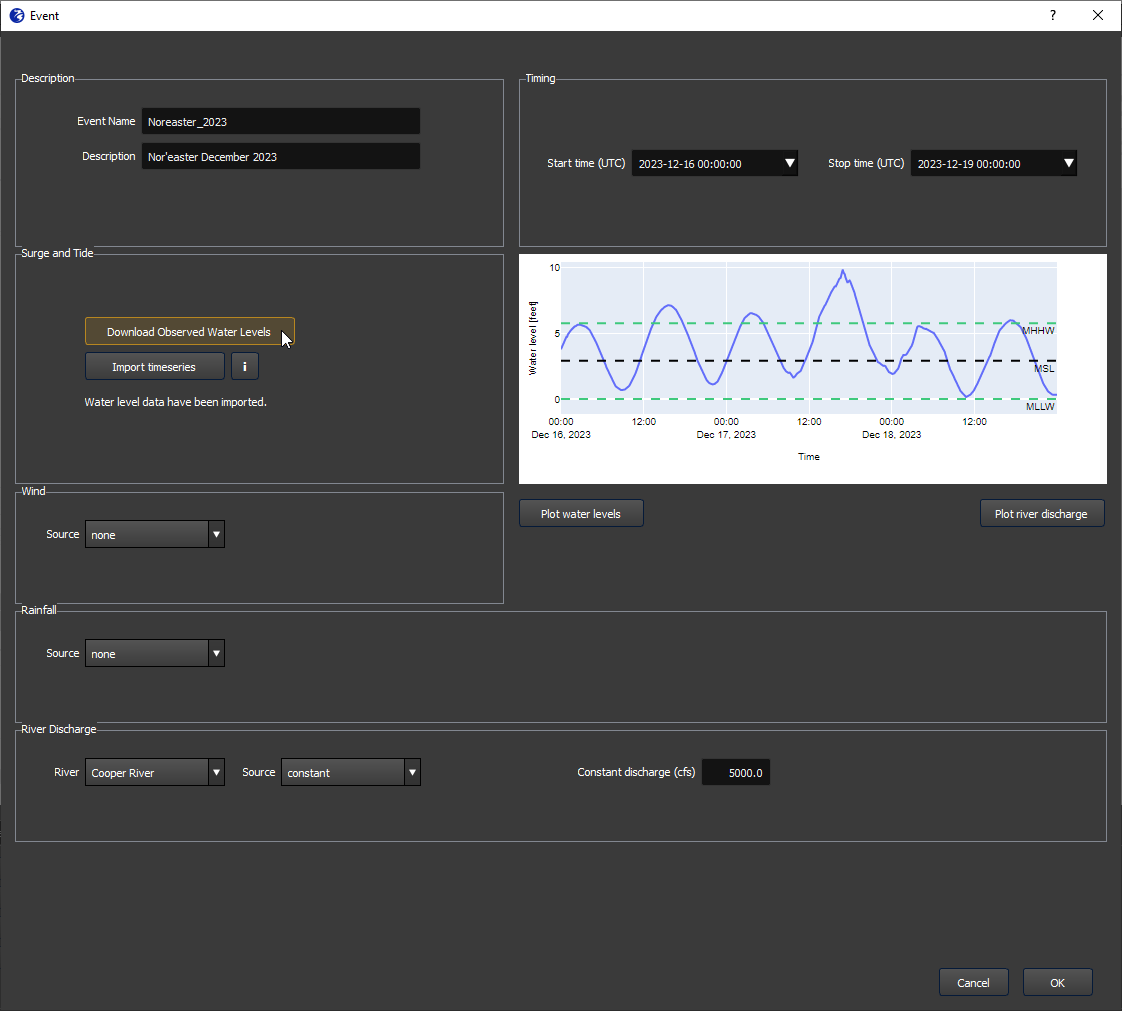
When the user selects the “Historical event - using gauged water levels” option from the Events tab, they will see the event template window shown in Figure 1. This window allows the user to input the historic time series for:
Water levels
In this documentation, we refer to water levels as the combined effect of (1) astronomoical tide and (2) the surge caused by wind.
If the user wants to download water levels automatically from gauge data they should:
- Select a start and stop time for the event
- Click the button “Download Observed Water Levels”
The plot window will then show the time series of the water levels over the duration specified by the start and stop time (see example in Figure 1).
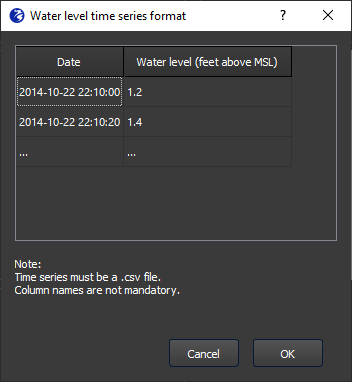
Alternatively, a user can import a water level time series. The water level time series should be a two-column csv. The first column contains the date and time in the format yyyy-mm-dd hh:mm:ss, and the second column contains the water level relative to mean sea level (MSL). The units of the water level will depend on how the system is configured. In the event specification window, you will find an “i” button next to the option to import a time series. Clicking this button will display an example of the format required for the csv, including the water level units.
Rainfall
The user has four options for entering the rainfall for the event:
None - Selecting this option means that no rainfall will be included in the calculation. This is the default option.
Constant - For a constant rainfall, the user is asked to enter a rainfall intensity. This rainfall will be applied over the entire duration of the event.
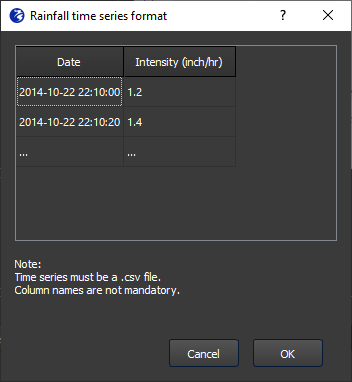
Timeseries - The user can upload a rainfall time series; this should be a two-column csv. The first column contains the date and time in the format yyyy-mm-dd hh:mm:ss, and the second column contains the rainfall intensity (depth/time). The units of the rainfall will depend on how the system is configured. In the event specification window, when you choose ‘timeseries’ for the rainfall source, you will see an “i” button appear. Clicking this button will display an example of the format required for the csv, including the rainfall intensity units.
Map - The map option downloads spatially and temporally varying rainfall at coarse spatial resolution (0.5 degrees for dates prior to February 2021, and 0.25 degrees after) from the NOAA global forecasting system reanalysis data.
When a user inputs rain data as timeseries or uses the Map option, they have the option to increase the rainfall by a specified percentage (referred to as the precipitation magnifier). This is to answer questions like “what would have happened if the rainfall during that high tide would have been twice as intense?”
Wind
The largest effect of wind on flooding is the surge it causes in the water levels. For gauged events, this effect is already included in the meausured water levels. The (more limited) role wind plays in this event type is to skew the water levels from the model boundary (usually near the gauge) to the land. Unless this is of particular interest to a user, the wind can be ignored.
The user has four options for entering wind for the event:
None - Selecting none means no wind will be included in the calculation. This is the default option.
Constant - For a constant wind speed, the user is asked to enter the wind speed and wind direction.
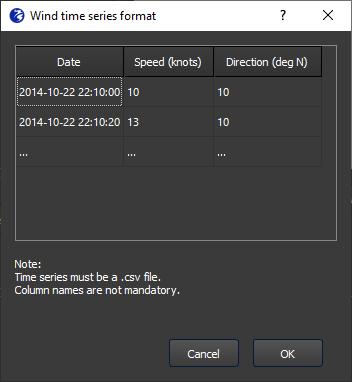
Timeseries - The user can upload a wind time series; this should be a three-column csv. The first column contains the date and time in the format yyyy-mm-dd hh:mm:ss, the second column contains the wind speed, and the third column contains the wind direction. The units of the wind speed and direction will depend on how the system is configured. In the event specification window, when you choose ‘timeseries’ for the wind source, you will see an “i” button appear. Clicking this button will display an example of the format required for the csv, including the units.
Map - The map option downloads spatially and temporally varying wind data at coarse spatial resolution (0.5 degrees for dates prior to February 2021, and 0.25 degrees after) from the NOAA global forecasting system reanalysis data.
River discharge
The river discharge represents the discharge in a river at the model boundary. If there are multiple rivers at the model boundary, the user will be able to select each river to specify the discharge. The user has two options for specifying the river discharge: a constant discharge or a time series.
Constant - This is the default option. An average discharge value is filled in, which is specified in a FloodAdapt configuration folder at system setup. The user can change the value of the constant discharge in the event specification window.
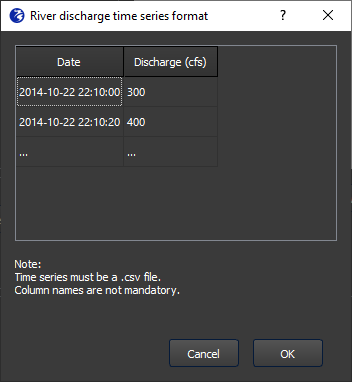
Timeseries - - The user can upload a river discharge time series; this should be a two-column csv. The first column contains the date and time in the format yyyy-mm-dd hh:mm:ss, the second column contains the river discharge. The units of the river discharge will depend on how the system is configured. In the event specification window, when you choose ‘timeseries’ for the river discharge source, you will see an “i” button appear. Clicking this button will display an example of the format required for the csv, including the units.