Compare tabs
Being able to compare scenarios is important when addressing user questions. For example, consider the question “How would a historic storm look with sea evel rise?” This question is best answered by simulating the historic storm without and then with sea level rise and comparing the output to evaluate where and by how much flooding and impacts would increase.
FloodAdapt supports users in comparing scenarios with two comparison tabs, one to compare spatial output and one to compare scenario metrics. These are described in separate sections below.
Comparing spatial output
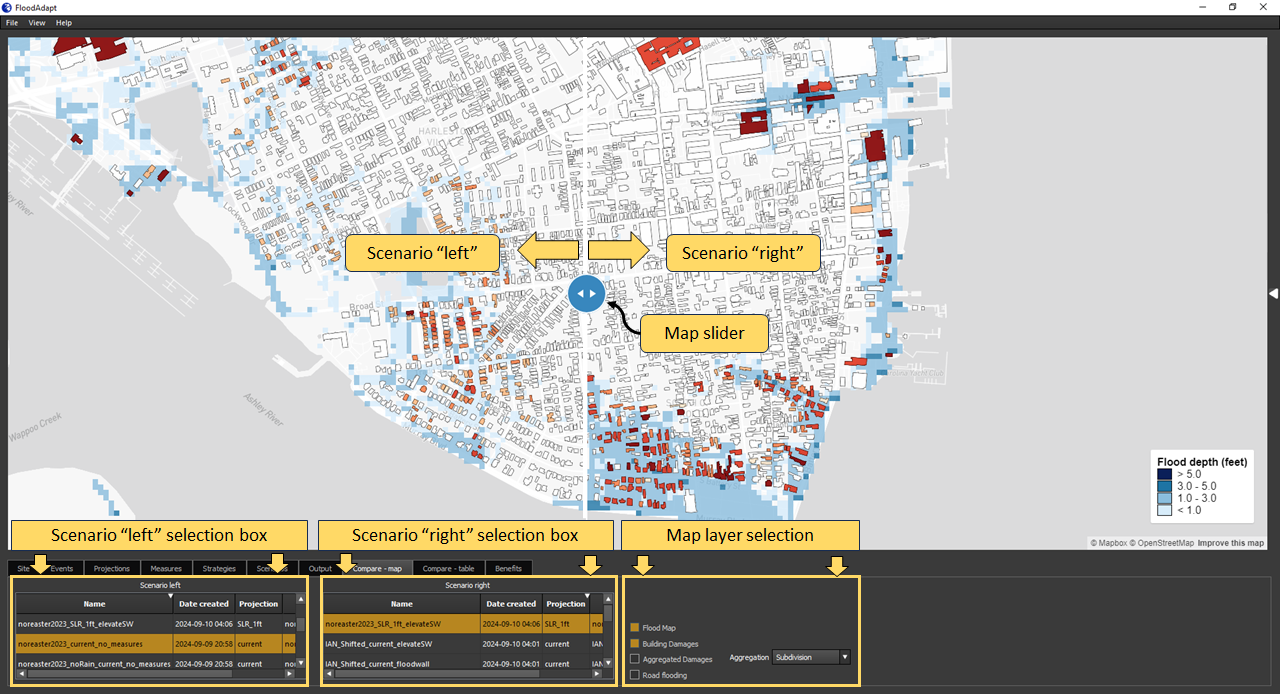
The “Compare - map” tab in FloodAdapt (see Figure 1) allows users to compare the spatial output of two scenarios using a slider bar in the map window. The lower panel has two selection boxes, one to select the scenario that will show up on the left side of the slider bar, and one to select the scenario that will show up on the right side of the slider bar.
To compare the spatial output of two scenarios:
- Go to the “Compare - map” tab
- Select a scenario in the “Scenario left” selection box
- Select a scenario in the “Scenario right” selection box
- Select the map layers you wish to view
- In the map window, drag the slider bar left and right to compare the spatial output
Once a selection is made in the “Scenario left” selection box, the “Scenario right” selection box will update to only include scenarios of the same type - either a risk scenario or event scenario. Because the output differs between these scenario types, only scenarios of the same type can be compared.
Comparing output metrics
In addition to comparing the spatial output, it is informative to compare scenario output metrics, such as residential damages or the number of businesses impacted. This helps summarize the impacts and how they are changing under different scenarios.
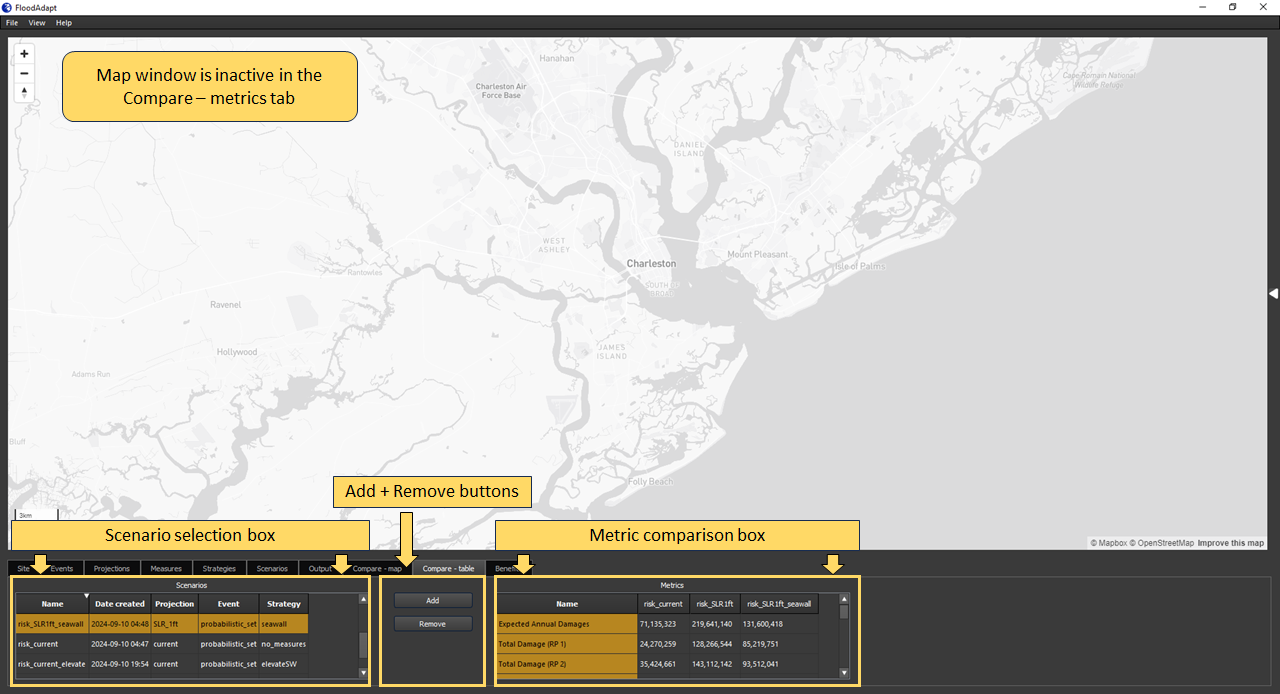
The “Compare - table” tab (see Figure 2) allows users to select multiple scenarios and add them to a metrics comparison box. There is no limit on the number of scenarios that can be compared.
To compare scenario output metrics:
- Select a scenario in the scenario selection box
- Click the “Add” button
- Repeat the above steps until all of the scenarios you wish to compare are included in the metric comparison box
If you want to remove a scenario from the metric comparison box:
- Select the column of the scenario in the metric comparison box
- Click the “Remove” button
Similar to the spatial comparison tab, once a scenario has been added to the metric comparison box, the scenario selection box will update to only include scenarios of the same type - either a risk scenario or an event scenario. Because the output differs between these scenario types, only scenarios of the same type can be compared.

